

Question: Analyze the fuel consumption data in Table B. 18 for multicollinearity. y X2 X3 X4 xs X6 X7 Xg 343 0 52.8 811.7 2.11 220
Analyze the fuel consumption data in Table B. 18 for multicollinearity.
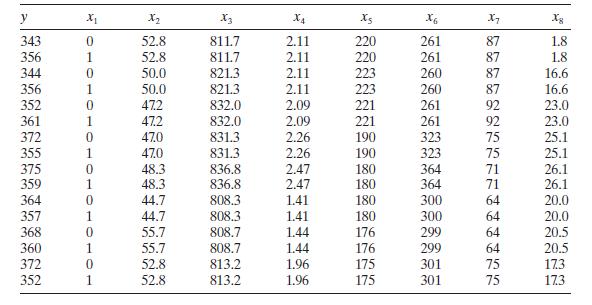
y X2 X3 X4 xs X6 X7 Xg 343 0 52.8 811.7 2.11 220 261 87 1.8 356 1 52.8 811.7 2.11 220 261 87 1.8 344 0 50.0 821.3 2.11 223 260 87 16.6 356 1 50.0 821.3 2.11 223 260 87 16.6 352 0 47.2 832.0 2.09 221 261 92 23.0 361 1 47.2 832.0 2.09 221 261 92 23.0 372 0 47.0 831.3 2.26 190 323 75 25.1 355 1 47.0 831.3 2.26 190 323 75 25.1 375 0 48.3 836.8 2.47 180 364 71 26.1 359 1 48.3 836.8 2.47 180 364 71 26.1 364 0 44.7 808.3 1.41 180 300 64 20.0 357 1 44.7 808.3 1.41 180 300 64 20.0 368 0 55.7 808.7 1.44 176 299 64 20.5 360 1 55.7 808.7 1.44 176 299 372 0 52.8 813.2 1.96 352 1 52.8 813.2 1.96 775 175 301 175 301 4 75 75 64 20.5 173 75 17.3
Step by Step Solution
3.38 Rating (154 Votes )
There are 3 Steps involved in it
The correlation matrix of the variables provides insights into potential multicollinearity Multicoll... View full answer

Get step-by-step solutions from verified subject matter experts