

Question: Analyze the patient satisfaction data in Table B. 17 for multicollinearity. Satisfaction Age Severity Surgical-Medical Anxiety 68 55 50 0 2.1 77 46 24 1
Analyze the patient satisfaction data in Table B. 17 for multicollinearity.
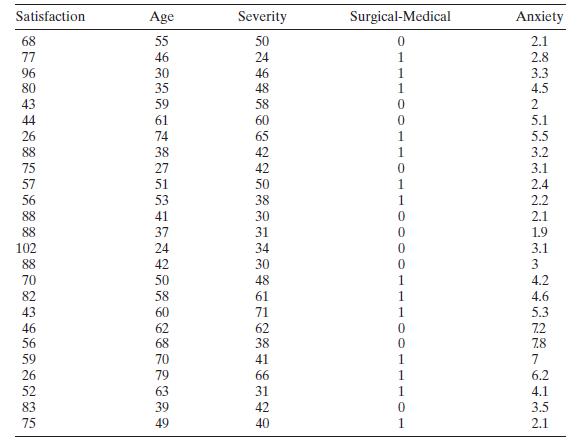
Satisfaction Age Severity Surgical-Medical Anxiety 68 55 50 0 2.1 77 46 24 1 2.8 96 30 46 1 3.3 80 35 48 1 4.5 43 59 58 0 2 44 61 0 5.1 26 74 88 38 75 27 57 51 56 53 41 88 37 102 24 88 42 70 82 43 46 56 59 26 52 83 75 49 OPPORT 41 79 31 39 BEEEEEEEEEE 65 1 5.5 42 1 3.2 42 0 3.1 50 1 2.4 38 1 2.2 30 0 31 0 2.1 1.9 34 0 3.1 30 0 3 48 1 61 1 71 1 62 0 38 0 7 66 1 42 40 993 4.2 4.6 5.3 7.2 7.8 6.2 4.1 3.5 2.1
Step by Step Solution
There are 3 Steps involved in it
The correlation matrix for the patient satisfaction data reveals the following relationships between ... View full answer

Get step-by-step solutions from verified subject matter experts