

Question: Consider the gasoline mileage data in Table B.3. Split the data into estimation and prediction sets. a. Evaluate the statistical properties of these data sets.
Consider the gasoline mileage data in Table B.3. Split the data into estimation and prediction sets.
a. Evaluate the statistical properties of these data sets.
b. Fit a model involving \(x_{1}\) and \(x_{6}\) to the estimation data. Do the coefficients and fitted values from this model seem reasonable?
c. Use this model to predict the observations in the prediction data set. What is your evaluation of this model's predictive performance?
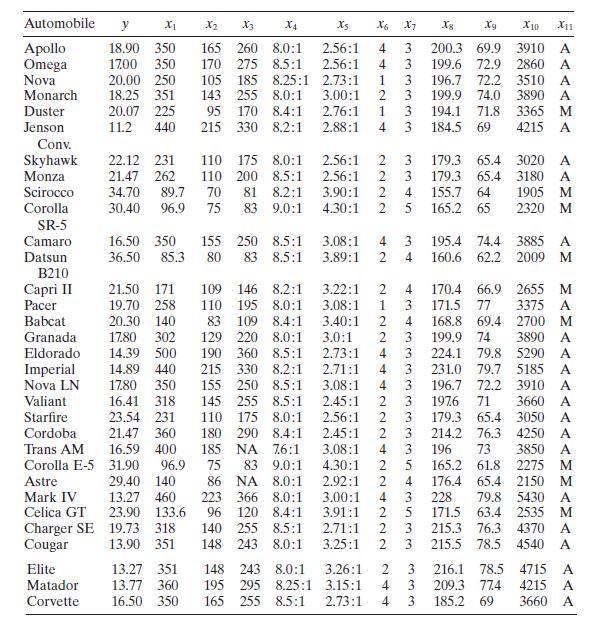
Automobile y X2 X3 X4 Xs X6 X7 8 Xg X10 X11 Apollo 18.90 350 Omega 1700 350 Nova 20.00 250 Monarch 18.25 351 143 255 Duster 20.07 225 Jenson 11.2 440 165 260 8.0:1 170 275 8.5:1 105 185 8.25:1 8.0:1 95 170 8.4:1 215 330 8.2:1 2.56:1 4 2.56:1 2.73:1 1 3 3.00:1 2 3 2.76:1 1 3 2.88:1 4 3 4 3 200.3 69.9 3910 A 3 199.6 72.9 2860 A 3333 196.7 72.2 3510 A 199.9 74.0 3890 A 194.1 71.8 3365 M 184.5 69 4215 A Conv. Skyhawk 22.12 231 110 175 Monza Scirocco 21.47 262 34.70 89.7 Corolla 30.40 96.9 8.0:1 110 200 8.5:1 70 81 8.2:1 75 83 2.56:1 23 2.56:1 23 179.3 65.4 3020 A 179.3 65.4 3180 A 3.90:1 2 4 155.7 64 1905 M 9.0:1 4.30:1 25 165.2 65 2320 M SR-5 Camaro 16.50 350 Datsun 36.50 85.3 155 250 80 83 8.5:1 3.08:1 8.5:1 3.89:1 2 4 34 195.4 74.4 3885 A 160.6 62.2 2009 M B210 Capri II 21.50 171 Pacer 19.70 258 Babcat 20.30 140 109 146 8.2:1 3.22:1 110 195 8.0:1 3.08:1 83 109 8.4:1 3.40:1 Granada 17.80 302 129 220 8.0:1 3.0:1 Eldorado 14.39 500 190 360 8.5:1 2.73:1 Imperial 14.89 440 215 330 8.2:1 2.71:1 Nova LN 17.80 350 155 250 8.5:1 3.08:1 Valiant 16.41 318 145 255 8.5:1 2.45:1 Starfire 23.54 231 110 175 8.0:1 2.56:1 Cordoba 21.47 360 180 290 8.4:1 2.45:1 Trans AM 16.59 400 185 NA 76:1 3.08:1 Corolla E-5 31.90 96.9 75 83 9.0:1 4.30:1 Astre 29.40 140 86 NA 8.0:1 2.92:1 Mark IV 13.27 460 223 366 8.0:1 3.00:1 Celica GT 23.90 133.6 96 120 8.4:1 3.91:1 Charger SE 19.73 318 Cougar 13.90 351 140 255 8.5:1 148 243 8.0:1 2.71:1 3.25:1 2 21224442224224222 4 170.4 66.9 2655 M 3 2 2 2 43 25 2 3 3 3 171.5 77 3375 A 4 168.8 69.4 2700 M 3 199.9 74 3890 A 3 224.1 79.8 5290 A 3 231.0 79.7 5185 A 196.7 72.2 3910 A 3 1976 71 3660 A 3 179.3 65.4 3050 A 3 214.2 76.3 4250 A 3 196 73 3850 A 5 165.2 61.8 2275 M 4 176.4 65.4 2150 M 228 79.8 5430 A 171.5 63.4 2535 M 215.3 76.3 4370 A 215.5 78.5 4540 A Elite 13.27 351 148 243 8.0:1 3.26:1 Matador Corvette 13.77 360 195 295 8.25:1 3.15:1 16.50 350 165 255 8.5:1 2.73:1 4 3 244 3 216.1 78.5 4715 A 3 209.3 77.4 4215 A 185.2 69 3660 A
Step by Step Solution
3.34 Rating (145 Votes )
There are 3 Steps involved in it

Get step-by-step solutions from verified subject matter experts