

Question: Consider the house price data in Table B.4. a. Fit a multiple regression model relating selling price to all nine regressors. b. Test for significance
Consider the house price data in Table B.4.
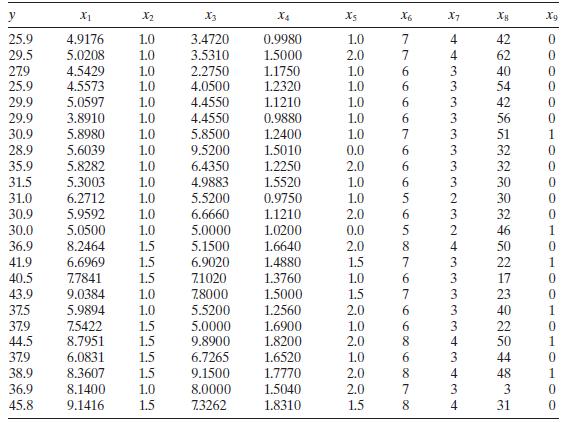
a. Fit a multiple regression model relating selling price to all nine regressors.
b. Test for significance of regression. What conclusions can you draw?
c. Use $t$ tests to assess the contribution of each regressor to the model. Discuss your findings.
d. What is the contribution of lot size and living space to the model given that all of the other regressors are included?
e. Is multicollinearity a potential problem in this model?
X1 X2 X3 X4 X5 X6 X7 25.9 4.9176 1.0 3.4720 0.9980 1.0 29.5 5.0208 1.0 3.5310 1.5000 2.0 27.9 4.5429 1.0 2.2750 1.1750 1.0 25.9 4.5573 1.0 4.0500 1.2320 1.0 29.9 5.0597 1.0 4.4550 1.1210 1.0 29.9 3.8910 1.0 4.4550 0.9880 1.0 30.9 5.8980 1.0 5.8500 1.2400 1.0 28.9 5.6039 1.0 9.5200 1.5010 0.0 35.9 5.8282 1.0 6.4350 1.2250 2.0 31.5 5.3003 1.0 4.9883 1.5520 1.0 31.0 6.2712 1.0 5.5200 0.9750 1.0 30.9 5.9592 1.0 6.6660 1.1210 2.0 30.0 5.0500 1.0 5.0000 1.0200 0.0 36.9 8.2464 1.5 5.1500 1.6640 2.0 41.9 6.6969 1.5 6.9020 1.4880 1.5 40.5 7.7841 1.5 71020 1.3760 1.0 43.9 9.0384 1.0 7.8000 1.5000 1.5 37.5 5.9894 1.0 5.5200 1.2560 2.0 37.9 7.5422 1.5 5.0000 1.6900 1.0 44.5 8.7951 1.5 9.8900 1.8200 2.0 37.9 6.0831 1.5 6.7265 1.6520 1.0 38.9 8.3607 1.5 9.1500 1.7770 2.0 36.9 8.1400 1.0 8.0000 1.5040 2.0 45.8 9.1416 1.5 7.3262 1.8310 1.5 5966665666565876766% 6 8 7 8 AA A + 42 4 62 0 3 40 3 3 3 3 3 32 3 32 3 2 3 2 4 3 3 3 3 3 882848 4 4 48 3 3 4 31 0010
Step by Step Solution
3.43 Rating (150 Votes )
There are 3 Steps involved in it

Get step-by-step solutions from verified subject matter experts