

Question: In Problem 2.4 you were asked to compute a $95 %$ CI on mean gasoline prediction interval on mileage when the engine displacement $x_{1}=275$ in.
In Problem 2.4 you were asked to compute a $95 %$ CI on mean gasoline prediction interval on mileage when the engine displacement $x_{1}=275$ in. $^{3}$ Compare the lengths of these intervals to the lengths of the confidence and prediction intervals from Problem 3.5 above. Does this tell you anything about the benefits of adding $x_{6}$ to the model?
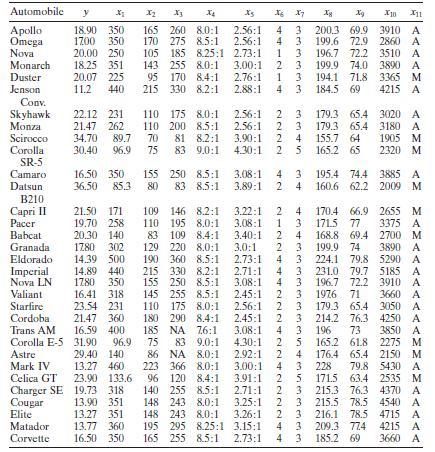
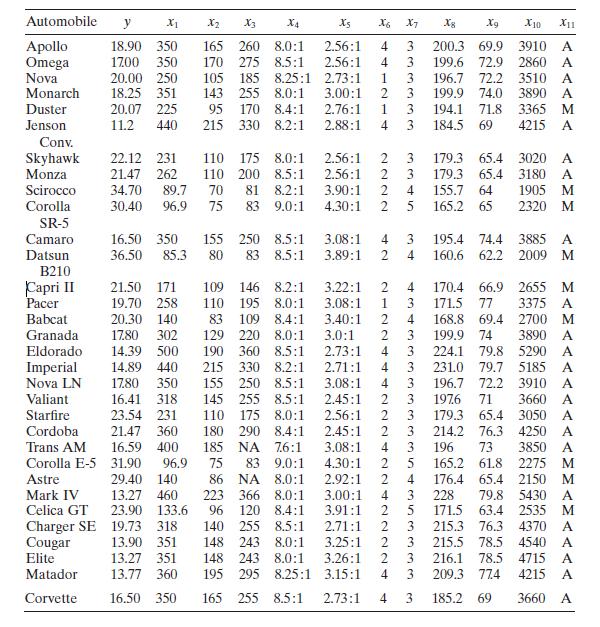
Data From Problem 2.4
Table B. 3 presents data on the gasoline mileage performance of 32 different automobiles.
a. Fit a simple linear regression model relating gasoline mileage $y$ (miles per gallon) to engine displacement $x_{1}$ (cubic inches).
b. Construct the analysis-of-variance table and test for significance of regression.
c. What percent of the total variability in gasoline mileage is accounted for by the linear relationship with engine displacement?
d. Find a $95 % \mathrm{CI}$ on the mean gasoline mileage if the engine displacement is 275 in. $^{3}$
e. Suppose that we wish to predict the gasoline mileage obtained from a car with a 275 -in. ${ }^{3}$ engine. Give a point estimate of mileage. Find a $95 %$ prediction interval on the mileage.
f. Compare the two intervals obtained in parts $d$ and e. Explain the difference between them. Which one is wider, and why?
Data From Problem 3.5
Consider the gasoline mileage data in Table B.3.
a. Fit a multiple linear regression model relatmg gasoline mileage $y$ (miles per gallon) to engine displacement $x_{1}$ and the number of carburetor barrels $x_{6}$.
b. Construct the analysis-of-variance table and test for significance of regression.
c. Calculate $R^{2}$ and $R_{\text {Adj }}^{2}$ for this model. Compare this to the $R^{2}$ and the $R_{\text {Adj }}^{2}$ for the simple linear regression model relating mileage to engine displacement in Problem 2.4.
d. Find a $95 %$ CI for $\beta_{1}$.
e. Compute the $t$ statistics for testing $H_{0}$ : $\beta_{1}=0$ and $H_{0}$ : $\beta_{6}=0$. What conclusions can you draw?
f. Find a $95 %$ CI on the mean gasoline mileage when $x_{1}=275$ in. $^{3}$ and $x_{6}=2$ barrels.
g. Find a $95 %$ prediction interval for a new observation on gasoline mileage when $x_{1}=275$ in. ${ }^{3}$ and $x_{6}=2$ barrels.
Automobile y X1 X2 X3 Xt xs X6 X7 X X X1 X11 Apollo 18.90 350 165 260 8.0:1 2.56:1 4 3 200.3 69.9 3910 A Omega 1700 350 170 275 8.5:1 2.56:1 4 3 199.6 72.9 2860 A Nova 20.00 250 105 185 8.25:1 2.73:1 1 3 196.7 72.2 3510 A Monarch 18.25 351 143 255 8.0:1 3.00:1 2 3 199.9 74.0 3890 A Duster 20.07 225 95 170 8.4:1 2.76:1 1 3 194.1 71.8 3365 M Jenson 11.2 440 215 330 8.2:1 2.88:1 4 3 184.5 69 4215 A Conv. Skyhawk 22.12 231 110 175 8.0:1 2.56:1 2 3 179.3 65.4 3020 A Monza 21.47 262 110 200 8.5:1 2.56:1 2 3 179.3 65.4 3180 A Scirocco 34.70 89.7 70 81 8.2:1 3.90:1 2 4 155.7 64 1905 M Corolla 30.40 96.9 75 83 9.0:1 4.30:1 2 5 165.2 65 2320 M SR-5 Camaro 16.50 350 155 250 8.5:1 3.08:1 4 3 195.4 74.4 3885 A Datsun 36.50 85.3 80 83 8.5:1 3.89:1 2 4 160.6 62.2 2009 M B210 Capri II 21.50 171 109 146 8.2:1 3.22:1 2 4 170.4 66.9 2655 M Pacer 19.70 258 110 195 8.0:1 3.08:1 1 3 171.5 77 3375 A Babcat 20.30 140 83 109 8.4:1 3.40:1 2 4 168.8 69.4 2700 M Granada 1780 302 129 220 8.0:1 3.0:1 2 3 199.9 74 3890 A Eldorado 14.39 500. 190 360 8.5:1 2.73:1 4 3 224.1 79.8 5290 A Imperial 14.89 440 215 330 8.2:1 2.71:1 4 3 231.0 79.7 5185 A Nova LN 1780 350 155 250 8.5:1 3.08:1 4 3 196.7 72.2 3910 A Valiant 16.41 318 Starfire 23.54 231 Cordoba 21.47 360 Trans AM 16.59 400 Corolla E-5 31.90 96.9 145 255 8.5:1 110 175 180 290 8.4:1 185 NA 76:1 75 83 9.0:1 2.45:1 2 3 1976 71 3660 A 8.0:1 2.56:1 2 3 2.45:1 2 3 179.3 65.4 3050 A 214.2 76.3 4250 A 3.08:1 3.08:1 4 3 196 73 3850 A 4.30:1 25 165.2 61.8 2275 M Astre 29.40 140 86 NA 8.0:1 2.92:1 2 4 Mark IV Celica GT 13.27 460 223 366 8.0:1 23.90 133.6 96 120 8.4:1 3.91:1 Charger SE 19.73 318 19.73 318 Cougar 13.90 351 Elite Matador Corvette 13.27 351 13.77 360 16.50 350 140 255 8.5:1 148 243 8.0:1 148 243 8.0:1 195 295 8.25:1 165 255 8.5:1 3.00:1 4 3 2 5 2.71:1 2 3 3.25:1 2 3 3.26:1 2 3 3.15:1 4 3 2.73:1 4 3 176.4 228 79.8 5430 A 171.5 63.4 2535 M 215.3 76.3 4370 A 215.5 78.5 4540 A 216.1 78.5 4715 A 209.3 774 65.4 2150 M 4215 A 185.2 69 3660 A
Step by Step Solution
3.56 Rating (153 Votes )
There are 3 Steps involved in it

Get step-by-step solutions from verified subject matter experts