

Question: Consider the methanol oxidation data in Table B.20. Perform a thorough analysis of these data. What conclusions do you draw from this analysis? x x2
Consider the methanol oxidation data in Table B.20. Perform a thorough analysis of these data. What conclusions do you draw from this analysis?
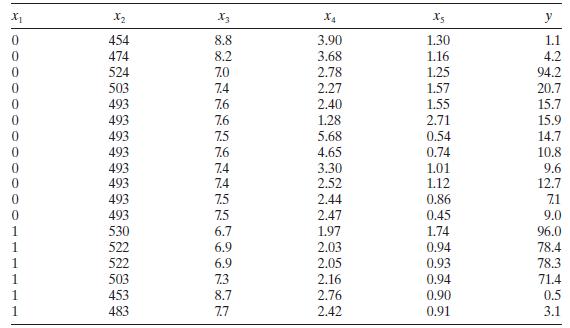
x x2 X3 X4 y 0 454 8.8 3.90 1.30 1.1 0 474 8.2 3.68 1.16 4.2 0 524 7.0 2.78 1.25 94.2 0 503 7.4 2.27 1.57 20.7 0 493 7.6 2.40 1.55 15.7 0 493 7.6 1.28 2.71 15.9 0 493 7.5 5.68 0.54 14.7 0 493 7.6 4.65 0.74 10.8 0 493 7.4 3.30 1.01 9.6 0 493 7.4 2.52 1.12 12.7 0 493 7.5 2.44 0.86 7.1 493 7.5 2.47 0.45 9.0 530 6.7 1.97 1.74 96.0 522 6.9 2.03 0.94 78.4 522 6.9 2.05 0.93 78.3 503 7.3 2.16 0.94 71.4 453 8.7 2.76 0.90 0.5 483 7.7 2.42 0.91 3.1
Step by Step Solution
3.52 Rating (165 Votes )
There are 3 Steps involved in it

Get step-by-step solutions from verified subject matter experts