

Question: Problem 3.8 asked you to fit two different models to the chemical process data in Table B.5. Perform appropriate residual analyses for both models. Discuss
Problem 3.8 asked you to fit two different models to the chemical process data in Table B.5. Perform appropriate residual analyses for both models. Discuss the results of these analyses. Calculate the PRESS statistic for both models. Do the residual plots and PRESS provide any insight regarding the best choice of model for the data?
Problem 3.8
The data in Table B. 5 present the performance of a chemical process as a function of several controllable process variables.
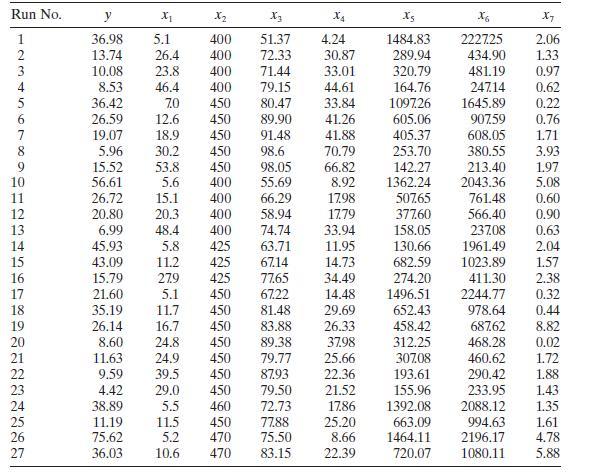
Run No. X2 x4 Xs X6 X7 1234567OLDIEREN 36.98 5.1 400 51.37 4.24 1484.83 2227.25 2.06 13.74 26.4 400 72.33 30.87 289.94 434.90 1.33 10.08 23.8 400 71.44 33.01 320.79 481.19 0.97 8.53 46.4 400 79.15 44.61 164.76 247.14 0.62 36.42 70 450 80.47 33.84 1097.26 1645.89 0.22 26.59 12.6 450 89.90 41.26 605.06 90759 0.76 19.07 18.9 450 91.48 41.88 405.37 608.05 1.71 8 5.96 30.2 450 98.6 70.79 253.70 380.55 3.93 15.52 53.8 450 98.05 66.82 142.27 213.40 1.97 10 56.61 5.6 400 55.69 8.92 1362.24 2043.36 5.08 11 26.72 15.1 400 66.29 17.98 50765 761.48 0.60 20.80 20.3 400 58.94 17.79 377.60 566.40 0.90 6.99 48.4 400 74.74 33.94 158.05 237.08 0.63 45.93 5.8 425 63.71 11.95 130.66 1961.49 2.04 43.09 11.2 425 67.14 14.73 682.59 1023.89 1.57 15.79 279 425 77.65 34.49 274.20 411.30 2.38 21.60 5.1 450 67.22 14.48 1496.51 2244.77 0.32 18 35.19 11.7 450 81.48 29.69 652.43 978.64 0.44 19 26.14 16.7 450 83.88 26.33 458.42 687.62 8.82 20 8.60 24.8 450 89.38 37.98 312.25 468.28 0.02 21 11.63 24.9 450 79.77 25.66 307.08 460.62 1.72 22 9.59 39.5 450 87.93 22.36 193.61 290.42 1.88 23 4.42 29.0 450 79.50 21.52 155.96 233.95 1.43 24 38.89 5.5 460 72.73 17.86 1392.08 2088.12 1.35 25 11.19 11.5 450 77.88 25.20 663.09 994.63 1.61 26 75.62 5.2 470 75.50 8.66 1464.11 2196.17 4.78 27 36.03 10.6 470 83.15 22.39 720.07 1080.11 5.88
Step by Step Solution
3.38 Rating (176 Votes )
There are 3 Steps involved in it

Get step-by-step solutions from verified subject matter experts