

Question: Consider the simple linear regression model fit to the tank pressure and volume data in Problem 2.16. Problem 2.16 Carroll and Spiegelman (The Effects of
Consider the simple linear regression model fit to the tank pressure and volume data in Problem 2.16.
Problem 2.16
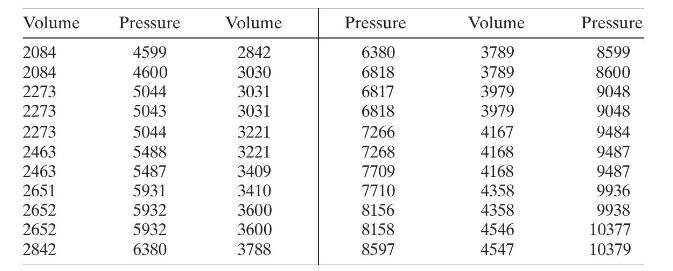
Carroll and Spiegelman ("The Effects of Ignoring Small Measurement Errors in Precision Instrument Calibration," Journal of Quality Technology, 18, 170$173,1986)$ look at the relationship between the pressure in a tank and the volume of liquid. The following table gives the data. Use an appropriate statistical software package to perform an analysis of these data. Comment on the output produced by the software routine.
a. Construct a normal probability plot of the residuals. Does there seem to be any problem with the normality assumption?
b. Construct and interpret a plot of the residuals versus the predicted response.
c. Suppose that the data were collected in the order shown in the table. Plot the residuals versus time order and comment on the plot.
Volume Pressure Volume Pressure Volume Pressure 2084 4599 2842 6380 3789 8599 2084 4600 3030 6818 3789 8600 2273 5044 3031 6817 3979 9048 2273 5043 3031 6818 3979 9048 2273 5044 3221 7266 4167 9484 2463 5488 3221 7268 4168 9487 2463 5487 3409 7709 4168 9487 2651 5931 3410 7710 4358 9936 2652 5932 3600 8156 4358 9938 2652 5932 3600 8158 4546 10377 2842 6380 3788 8597 4547 10379
Step by Step Solution
3.36 Rating (152 Votes )
There are 3 Steps involved in it

Get step-by-step solutions from verified subject matter experts