Question:
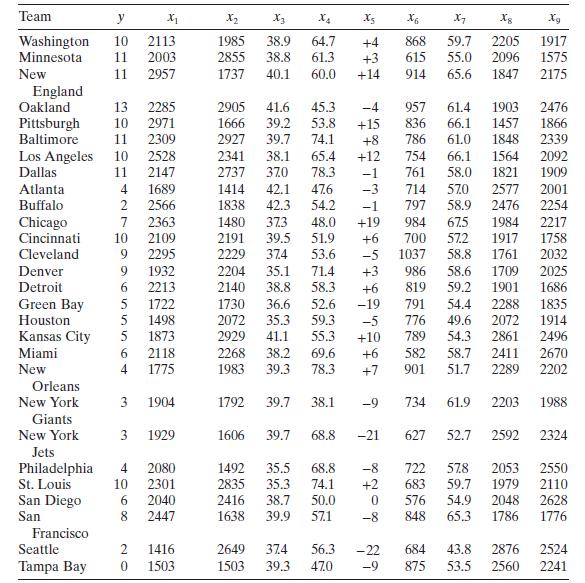
Reconsider the National Football League data from Problem 3.1. Fit a model to these data using only $x_{7}$ and $x_{8}$ as the regressors.
Data From Problem 3.1
Consider the National Football League data in Table B.1.
a. Test for significance of regression.
b. Calculate $R^{2}$ and $R_{\text {Adj }}^{2}$. How do these quantities compare to the values computed for the model in Problem 3.1, which included an additional regressor $\left(x_{2}\right)$ ?
c. Calculate a $95 %$ CI on $\beta_{7}$. Also find a $95 %$ CI on the mean number of games won by a team when $x_{7}=56.0$ and $x_{8}=2100$. Compare the lengths of these CIs to the lengths of the corresponding CIs from Problem 3.3.
d. What conclusions can you draw from this problem about the consequences of omitting an important regressor from a model?
Transcribed Image Text:
Team y X_ X2 X4 X5 X6 5 X7 8 Xg Washington 10 2113 1985 38.9 64.7 +4 868 59.7 2205 1917 Minnesota 11 2003 2855 38.8 61.3 +3 615 55.0 2096 1575 New 11 2957 1737 40.1 60.0 +14. 914 65.6 1847 2175 England Oakland 13 2285 2905 41.6 45.3 -4 957 61.4 1903 2476 Pittsburgh 10 2971 1666 39.2 53.8 +15 836 66.1 1457 1866 Baltimore 11 2309 2927 39.7 74.1 +8 786 61.0 1848 2339 Los Angeles 10 2528 2341 38.1 65.4 +12 754 66.1 1564 2092 Dallas 11 2147 2737 370 78.3 -1 761 58.0 1821 1909 Atlanta 4 1689 1414 42.1 47.6 -3 714 570 2577 2001 Buffalo 2 2566 1838 42.3 54.2 797 58.9 2476 2254 Chicago 7 2363 1480 373 48.0 +19 984 67.5 1984 2217 Cincinnati 10 2109 2191 39.5 51.9 +6 700 57.2 1917 1758 Cleveland 9 2295 2229 37.4 53.6 -5 1037 58.8 1761 2032 Denver 9 1932 2204 35.1 71.4 +3 986 58.6 1709 2025 Detroit 6 2213 2140 38.8 58.3 +6 819 59.2 1901 1686 Green Bay 5 1722 1730 36.6 52.6 -19 791 54.4 2288 1835 Houston 5 1498 2072 35.3 59.3 -5 776 49.6 2072 1914 Kansas City 5 1873 2929 41.1 55.3 +10 789 54.3 2861 2496 Miami 6 2118 2268 38.2 69.6 +6 582 58.7 2411 2670 New 4 1775 1983 39.3 78.3 +7 901 51.7 2289 2202 Orleans New York 3 1904 1792 39.7 38.1 Giants New York 3 1929 1606 39.7 68.8 Jets Philadelphia 4 2080 1492 35.5 68.8 St. Louis 10 2301 2835 35.3 74.1 San Diego 6 2040 2416 38.7 50.0 San 8 2447 1638 39.9 57.1 Francisco Seattle Tampa Bay 20 1416 2649 37.4 56.3 1503 1503 39.3 470 734 61.9 2203 1988 -21 627 52.7 2592 2324 722 57.8 2053 2550 +2 683 59.7 1979 2110 576 54.9 2048 2628 848 65.3 1786 1776 -22 684 43.8 2876 2524 875 53.5 2560 2241