

Question: Reconsider the pneumoconiosis data in Table 13.1. Fit models using both the probit and complimentary log-log functions. Compare these models to the one obtained in
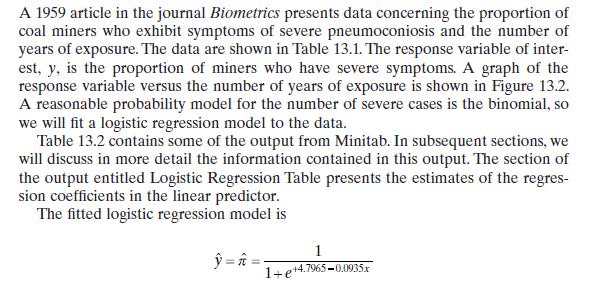
Reconsider the pneumoconiosis data in Table 13.1. Fit models using both the probit and complimentary log-log functions. Compare these models to the one obtained in Example 13.1 using the logit.
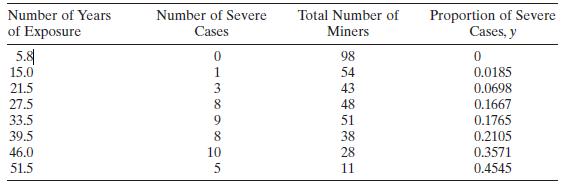
Table 13.1
Example 13.1
Number of Years of Exposure Number of Severe Cases Total Number of Miners Proportion of Severe Cases, y 5.8 15.0 21.5 27.5 33.5 39.5 46.0 51.5 01389805 98 0 54 0.0185 43 0.0698 48 0.1667 51 0.1765 38 0.2105 28 0.3571 11 0.4545
Step by Step Solution
★★★★★
3.42 Rating (161 Votes )
There are 3 Steps involved in it
1 Expert Approved Answer
Step: 1 Unlock

Question Has Been Solved by an Expert!
Get step-by-step solutions from verified subject matter experts
Step: 2 Unlock
Step: 3 Unlock