

Question: The data in the table below give the percentage share of market of a particular brand of canned peaches ( y t ) for the
The data in the table below give the percentage share of market of a particular brand of canned peaches ( y t ) for the past 15 months and the relative selling price ( x t ).
a. Fit a simple linear regression model to these data. Plot the residuals versus time. Is there any indication of autocorrelation?
b. Use the Durbin – Watson test to determine if there is positive autocorrelation in the errors. What are your conclusions?
c. Use one iteration of the Cochrane – Orcutt procedure to estimate the regression coeffi cients. Find the standard errors of these regression coeffi cients.
d. Is there positive autocorrelation remaining after the fi rst iteration? Would you conclude that the iterative parameter estimation technique has been successful?
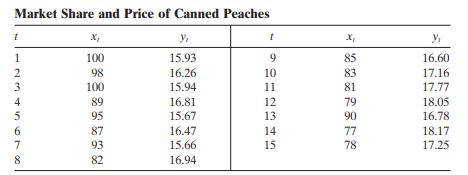
Market Share and Price of Canned Peaches xx Y x y 1 100 15.93 9 85 16.60 2345678 98 16.26 10 83 17.16 100 15.94 11 81 17.77 89 16.81 12 79 18.05 95 15.67 13 90 16.78 87 16.47 14 77 18.17 93 15.66 15 78 17.25 82 16.94
Step by Step Solution
There are 3 Steps involved in it

Get step-by-step solutions from verified subject matter experts