

Question: Consider the data in Exercise 14.3. Fit the lagged variables regression models shown in Eq. (14.26) and (14.27) to these data. Compare these models with
Consider the data in Exercise 14.3. Fit the lagged variables regression models shown in Eq. (14.26) and (14.27) to these data. Compare these models with the results you obtained in Exercise 14.3 using the Cochrane-Orcutt procedure, and with the time series regression model from Exercise 14.9.
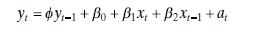
Equation 14.26
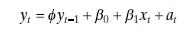
Equation 14.27
Data From Exercise 14.3
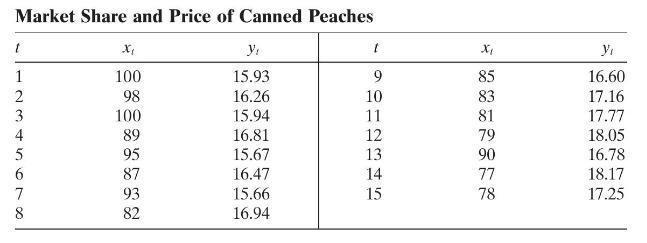
The data in the table below give the percentage share of market of a particular brand of canned peaches (yt)(yt)(yt) for the past 15 months and the relative selling price (xt)(xt)(xt).
a. Fit a simple linear regression model to these data. Plot the residuals versus time. Is there any indication of autocorrelation?
b. Use the Durbin-Watson test to determine if there is positive autocorrelation in the errors. What are your conclusions?
c. Use one iteration of the Cochrane-Orcutt procedure to estimate the regression coefficients. Find the standard errors of these regression coefficients.
d. Is there positive autocorrelation remaining after the first iteration? Would you conclude that the iterative parameter estimation technique has been successful?
Data From Exercise 14.9
Consider the data in Exercise 14.3. Fit a time series regression model with autocorrected errors to these data. Compare this model with the results you obtained in Exercise 14.3 using the Cochrane-Orcutt procedure.
Data From Exercise 14.3
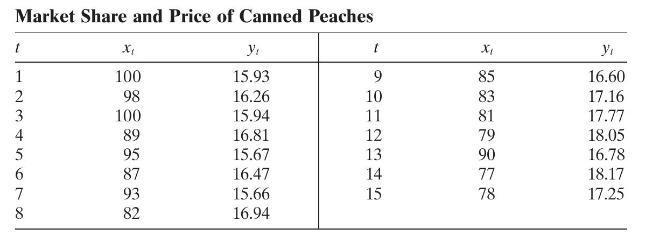
The data in the table below give the percentage share of market of a particular brand of canned peaches (yt)(yt) for the past 15 months and the relative selling price (xt)(xt).
a. Fit a simple linear regression model to these data. Plot the residuals versus time. Is there any indication of autocorrelation?
b. Use the Durbin-Watson test to determine if there is positive autocorrelation in the errors. What are your conclusions?
c. Use one iteration of the Cochrane-Orcutt procedure to estimate the regression coefficients. Find the standard errors of these regression coefficients.
d. Is there positive autocorrelation remaining after the first iteration? Would you conclude that the iterative parameter estimation technique has been successful?
Step by Step Solution
There are 3 Steps involved in it

Get step-by-step solutions from verified subject matter experts