

Question: The table below shows the condition indices and variance decomposition proportions for the acetylene data using centered regressors. Use this information to diagnose multicollinearity in
The table below shows the condition indices and variance decomposition proportions for the acetylene data using centered regressors. Use this information to diagnose multicollinearity in the data and draw appropriate conclusions.
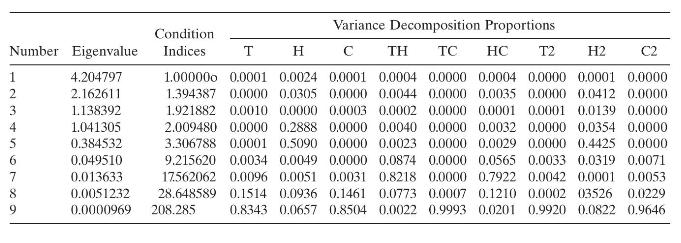
Condition 123456789 Number Eigenvalue Indices 4.204797 2.162611 1.138392 1.041305 0.384532 0.049510 0.013633 0.0051232 9 0.0000969 Variance Decomposition Proportions C TH TC HC T2 H2 C2 T H 1.000000 0.0001 0.0024 0.0001 0.0004 0.0000 0.0004 0.0000 0.0001 0.0000 1.394387 0.0000 0.0305 0.0000 0.0044 0.0000 0.0035 0.0000 0.0412 0.0000 1.921882 0.0010 0.0000 0.0003 0.0002 0.0000 0.0001 0.0001 0.0139 0.0000 2.009480 0.0000 0.2888 0.0000 0.0040 0.0000 0.0032 0.0000 0.0354 0.0000 3.306788 0.0001 0.5090 0.0000 0.0023 0.0000 0.0029 0.0000 0.4425 0.0000 9.215620 0.0034 0.0049 0.0000 0.0874 0.0000 0.0565 0.0033 0.0319 0.0071 17.562062 0.0096 0.0051 0.0031 0.8218 0.0000 0.7922 0.0042 0.0001 0.0053 28.648589 0.1514 0.0936 0.1461 0.0773 0.0007 0.1210 0.0002 03526 0.0229 208.285 0.8343 0.0657 0.8504 0.0022 0.9993 0.0201 0.9920 0.0822 0.9646
Step by Step Solution
There are 3 Steps involved in it

Get step-by-step solutions from verified subject matter experts