

Question: Analyze the methanol oxidation data in Table B. 20 for multicollinearity. x1 X2 X3 X4 xs 0 454 8.8 3.90 1.30 1.1 474 8.2 3.68
Analyze the methanol oxidation data in Table B. 20 for multicollinearity.
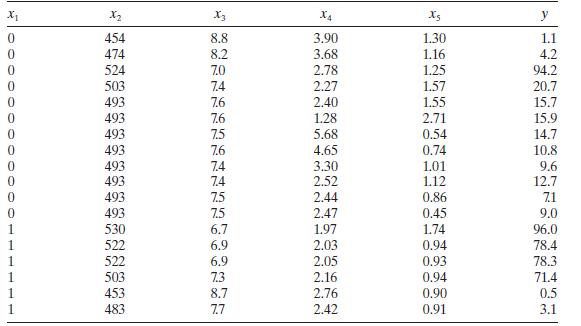
x1 X2 X3 X4 xs 0 454 8.8 3.90 1.30 1.1 474 8.2 3.68 1.16 4.2 524 7.0 2.78 1.25 94.2 503 7.4 2.27 1.57 20.7 493 7.6 2.40 1.55 15.7 493 7.6 1.28 2.71 15.9 493 7.5 5.68 0.54 14.7 493 7.6 4.65 0.74 10.8 493 7.4 3.30 1.01 9.6 493 7.4 2.52 1.12 12.7 493 7.5 2.44 0.86 71 493 7.5 2.47 0.45 9.0 530 6.7 1.97 1.74 96.0 522 6.9 2.03 0.94 78.4 522 6.9 2.05 0.93 78.3 503 7.3 2.16 0.94 71.4 453 8.7 2.76 0.90 0.5 483 7.7 2.42 0.91 3.1
Step by Step Solution
There are 3 Steps involved in it
The Variance Inflation Factor VIF values for the features are as follows X1 VIF 152 ... View full answer

Get step-by-step solutions from verified subject matter experts