

Question: Use the wine quality data in Table B. 11 to construct a regression model for quality using the stepwise regression approach. Compare this model to
Use the wine quality data in Table B. 11 to construct a regression model for quality using the stepwise regression approach. Compare this model to the one you found in Problem 10.4, part a.
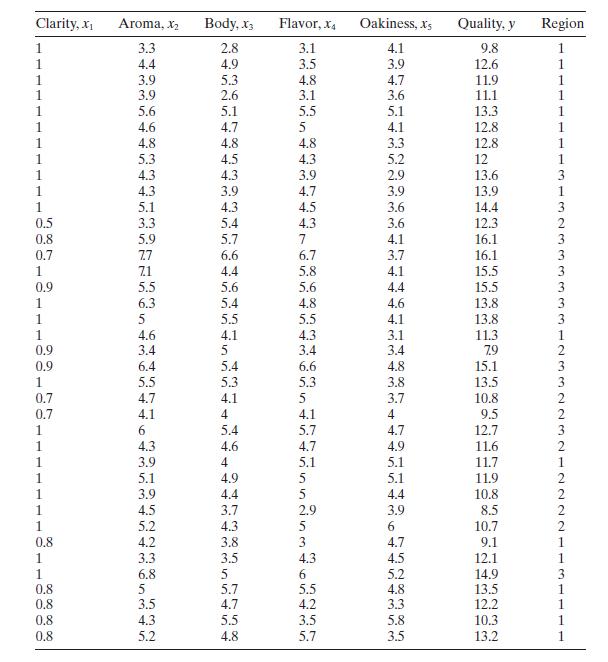
Data From Problem 10.4
Consider the solar thermal energy test data in Table B.2.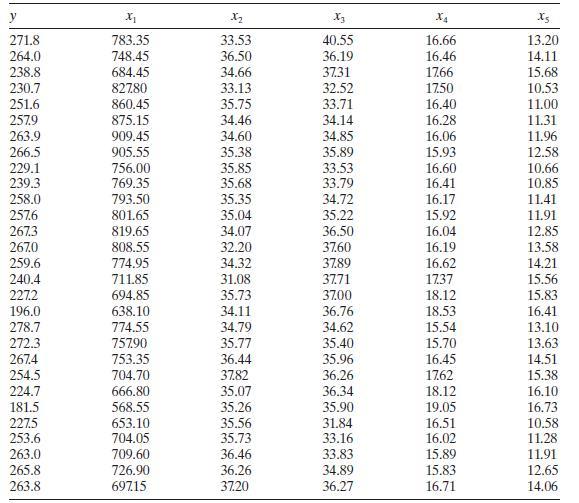
Clarity, x Aroma, X Body, X3 Flavor, X4 Oakiness, xs Quality, y Region 3.3 2.8 3.1 4.1 9.8 1 1 4.4 4.9 3.5 1 3.9 5.3 4.8 3.9 2.6 3.1 5.6 5.1 5.5 5815 3.9 12.6 1 4.7 11.9 1 3.6 11.1 1 5.1 13.3 1 4.6 4.7 5 4.1 12.8 4.8 4.8 4.8 1 1 1 1 1 1 1 LUCKS-88-66---6-888- 0.5 0.8 0.7 71 0.9 5 0.9 0.9 0.7 0.7 0.8 0.8 5 0.8 0.8 0.8 399888996988889386398 5.3 4.5 4.3 4.3 4.3 3.9 4.3 3.9 4.7 5.1 4.3 4.5 5.4 4.3 839853 3.3 12.8 1 5.2 12 1 2.9 13.6 3 3.9 13.9 1 3.6 14.4 3 3.6 12.3 5.9 5.7 7 4.1 16.1 7.7 6.6 6.7 4.4 5.8 5.5 5.6 5.6 5.4 4.8 5.5 5.5 4.6 4.1 4.3 3.4 5 3.4 7868534 3.7 16.1 4.1 15.5 4.4 15.5 4.6 13.8 4.1 13.8 3.1 11.3 3.4 7.9 6.4 5.4 6.6 4.8 15.1 5.5 5.3 5.3 3.8 13.5 4.7 4.1 5 3.7 10.8 4.1 4 4.1 4 9.5 5.4 5.7 4.7 12.7 4.3 4.6 4.7 4.9 11.6 4 5.1 5.1 11.7 5.1 4.9 5 5.1 11.9 4.4 5 4.4 10.8 4.5 3.7 2.9 3.9 8.5 5.2 4.3 5 6 10.7 4.2 3.8 3 4.7 9.1 3.5 4.3 4.5 12.1 3.5 4.3 5.2 54544 6 5.2 14.9 2333n en en en12332232222271S 3 3 2 2 2 2 2 2 5.7 5.5 4.7 4.2 5.5 3.5 5251 4.8 13.5 3.3 12.2 5.8 10.3 4.8 5.7 3.5 13.2 1
Step by Step Solution
3.32 Rating (149 Votes )
There are 3 Steps involved in it

Get step-by-step solutions from verified subject matter experts