

Question: Consider the life expectancy data given in Table B.16. Create an indicator variable for gender. Perform a thorough analysis of the overall average life expectancy.
Consider the life expectancy data given in Table B.16. Create an indicator variable for gender. Perform a thorough analysis of the overall average life expectancy. Discuss the results of this analysis relative to your previous analyses of these data.
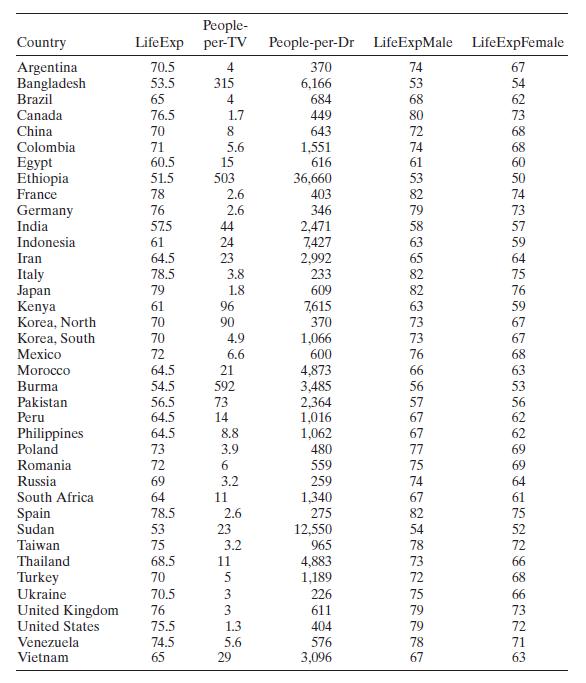
People- Country Argentina Life Exp per-TV People-per-Dr Life ExpMale Life ExpFemale 70.5 4 370 74 67 Bangladesh 53.5 315 6,166 53 54 Brazil 65 4 684 68 Canada 76.5 1.7 449 80 China 70 8 643 72 Colombia 71 5.6 1,551 74 Egypt 60.5 15 616 61 Ethiopia 51.5 503 36,660 53 France 78 2.6 403 82 Germany 76 2.6 346 India 57.5 44 2,471 Indonesia 61 24 7,427 Iran 64.5 23 2,992 65 Italy 78.5 3.8 233 Japan 79 1.8 609 82 Kenya 61 96 7,615 63 Korea, North 70 90 370 73 Korea, South 70 4.9 1,066 73 Mexico 72 6.6 600 76 Morocco 64.5 21 4,873 66 Burma 54.5 592 3,485 56 53 Pakistan 56.5 73 2,364 57 Peru 64.5 14 1,016 67 Philippines 64.5 8.8 1,062 67 Poland Romania 77 73 3.9 480 77 72 6 559 75 69 Russia 69 3.2 259 74 South Africa 64 11 1,340 67 Spain 78.5 2.6 275 82 Sudan 53 23 12,550 54 Taiwan 75 3.2 965 78 Thailand 68.5 Turkey 70 Ukraine 70.5 United Kingdom 76 1533 4,883 73 1,189 72 68 226 75 611 79 73 United States 75.5 1.3 404 79 72 Venezuela 74.5 5.6 576 78 Vietnam 65 29 3,096 67 BEN3222NKUOSOSKUSGOUNDCONNUS223 62 73 68 68 60 50 74 73 57 59 64 75 76 59 67 67 68 63 56 62 62 69 64 61 75 52 72 66 66 71 63
Step by Step Solution
3.37 Rating (147 Votes )
There are 3 Steps involved in it

Get step-by-step solutions from verified subject matter experts