New Semester
Started
Get
50% OFF
Study Help!
--h --m --s
Claim Now
Question Answers
Textbooks
Find textbooks, questions and answers
Oops, something went wrong!
Change your search query and then try again
S
Books
FREE
Study Help
Expert Questions
Accounting
General Management
Mathematics
Finance
Organizational Behaviour
Law
Physics
Operating System
Management Leadership
Sociology
Programming
Marketing
Database
Computer Network
Economics
Textbooks Solutions
Accounting
Managerial Accounting
Management Leadership
Cost Accounting
Statistics
Business Law
Corporate Finance
Finance
Economics
Auditing
Tutors
Online Tutors
Find a Tutor
Hire a Tutor
Become a Tutor
AI Tutor
AI Study Planner
NEW
Sell Books
Search
Search
Sign In
Register
study help
sciences
cambridge igcse and o level additional mathematics 1st edition
Cambridge IGCSE And O Level Additional Mathematics 1st Edition Val Hanrahan, Jeanette Powell - Solutions
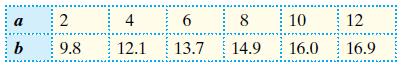
It is thought that the relationship between two variables, a and b, is of the form b = Pan. An experiment is conducted to test this assumption. The results are shown in the table.a. Show that the model can be written as lnb = nlna + lnP.b. Plot the graph of lnb against ln a and say why this
The points A, B and C have coordinates (2, 3), (6, 12) and (11, 7) respectively.a. Draw the triangle ABC.b. Show by calculation that the triangle is isosceles and write down the two equal sides.c. Work out the midpoint of the third side.d. By first calculating appropriate lengths, calculate the
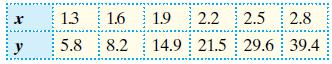
With the exception of one, all the results in table satisfy, to one decimal place, the relationship y = axn.a. Use a suitable logarithmic method to find the values of a and n.b. If the values of x are correct, identify the incorrect value of y and estimate the correct value to 1 d.p. 13 1.6 1.9 2.2
A. triangle ABC has vertices at A(3, 2), B(4, 0) and C(8, 2).a. Show that the triangle is right angled.b. Find the coordinates of point D such that ABCD is a rectangle.
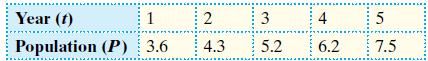
The population P (in thousands) of a new town is modelled by the relationship P = kat where t is the time in years. Its growth over the first five years is shown in the table below.a. Explain why you would expect that the graph of ln P against t to be a straight line.b. Draw up a table of values,
P(–2, 3), Q(1, q) and R(7, 0) are collinear points (i.e. they lie on the same straight line).a. Find the value of Q.b. Write down the ratio of the lengths PQ : QR.
A quadrilateral has vertices A(–2, 8), B(–5, 5), C(5, 3) and D(3, 7).a. Draw the quadrilateral.b. Show by calculation that it is a trapezium.c. ABCE is a parallelogram. Find the coordinates of E.
In each part, find the equation of the line through the given point that is: i. Parallel and ii. Perpendicular to the given line.a. y = 2x + 6; (5, −3)b. x + 3y + 5 = 0; (−4, 7)c. 2x = 3y + 1; (−1, −6)
Find the equation of the perpendicular bisector of the line joining each pair of points.a. (2, 3) and (8, −1)b. (−7, 3) and (1, 5)c. (5, 6) and (4, −3)
P is the point (2, −1) and Q is the point (8, 2).a. Write the equation of the straight line joining P and Q.b. Find the coordinates of M, the midpoint of PQ.c. Write the equation of the perpendicular bisector of PQ.d. Write down the coordinates of the points where the perpendicular bisector
Showing 400 - 500
of 410
1
2
3
4
5
Step by Step Answers