New Semester
Started
Get
50% OFF
Study Help!
--h --m --s
Claim Now
Question Answers
Textbooks
Find textbooks, questions and answers
Oops, something went wrong!
Change your search query and then try again
S
Books
FREE
Study Help
Expert Questions
Accounting
General Management
Mathematics
Finance
Organizational Behaviour
Law
Physics
Operating System
Management Leadership
Sociology
Programming
Marketing
Database
Computer Network
Economics
Textbooks Solutions
Accounting
Managerial Accounting
Management Leadership
Cost Accounting
Statistics
Business Law
Corporate Finance
Finance
Economics
Auditing
Tutors
Online Tutors
Find a Tutor
Hire a Tutor
Become a Tutor
AI Tutor
AI Study Planner
NEW
Sell Books
Search
Search
Sign In
Register
study help
sciences
introduction to geographic information
Introduction To Geographic Information Systems 9th Edition Kang-tsung Chang - Solutions
Explain image-to-map transformation.
An image-to-map transformation is sometimes called an image-to-world transformation. Why?
The affine transformation allows rotation, translation, skew, and differential scaling. Describe each of these transformations.
Operationally, an affine transformation involves three sequential steps. What are these steps?
Explain the role of control points in an affine transformation.
How are control points selected for a map-tomap transformation?
How are ground control points chosen for an image-to-map transformation?
Explain the role of the RMS error in an affine transformation.
Describe a scenario in which the RMS error may not be a reliable indicator of the goodness of a map-to-map transformation.
Why do we have to perform the resampling of pixel values following an image-to-map transformation?
Describe three common resampling methods for raster data.
The nearest neighbor method is recommended for resampling categorical data. Why?
Explain the difference between location errors and topological errors.
What are the primary data sources for digitizing?
Explain the importance of editing in GIS.
Although the U.S. National Map Accuracy Standard adopted in 1947 is still printed on USGS quadrangle maps, the standard is not really applicable to GIS data. Why?
According to the new National Standard for Spatial Data Accuracy, a geospatial data producer is encouraged to report a RMS statistic associated with a data set. In general terms, how does one interpret and use the RMS statistic?
Suppose a point location is recorded as (575729.0, 5228382) in data set 1 and (575729.64, 5228382.11) in data set 2. Which data set has a higher data precision? In practical terms, what does the difference in data precision in this case mean?
ArcGIS 10.5 Help has a poster illustrating topology rules (ArcGIS Desktop 10.5 Help>Manage Data>Editing>Editing topology>Geodatabase topology>Geodatabase topology rules and topology error fixes). View the poster. Can you think of an example (other than those on the poster) that can
Give an example (other than those on the poster) that can use the polygon rule of “Must not overlap with.”
Give an example (other than those on the poster) that can use the line rule of “Must not intersect or touch interior.”
The implementation of topology in ArcGIS is described as on-the-fly. Why?
Use a diagram to illustrate how a large cluster tolerance for editing can unintentionally alter the shapes of line features.
Explain the difference between a dangling node and a pseudo node.
What is a map topology?
Describe the three basic steps in using a topology rule.
Some nontopological editing operations can create features from existing features. Give two examples of such operations.
Edgematching requires a source layer and a target layer. Explain the difference between these two types of layers.
The Douglas-Peucker algorithm typically produces simplified lines with sharp angles. Why?
Name the two alternatives to the Douglas-Peucker algorithm for line generalization in ArcGIS.
What is a feature attribute table?
Provide an example of a nonspatial attribute table.
How does the geodatabase differ from the shape file in terms of storage of feature attribute data?
Describe the four types of attribute data by measurement scale.
Can you convert ordinal data into interval data? Why, or why not?
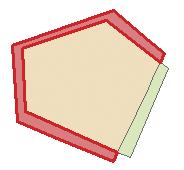
What does the result of a join operation between the zone table and the parcel table in Figure 8.9 look like? Parcel table Owner table PIN P101 P102 P103 P104 Sale date 1-10-98 10-6-68 3-7-97 7-30-78 PIN P101 P101 P102 P102 P103 P104 Acres Zone code 1.0 1 3.0 2 2.5 2 1.0 1 Owner
Explain the advantages of a relational database.
A fully normalized database may slow down data access. To increase the performance in data access, for example, one may remove the address table in Figure 8.9. How should the database be redesigned if the address table were removed? Parcel table Owner table PIN P101 P102 P103 P104 Sale
Why is a GIS database called an extended relational database?
Explain the similarity, as well as the difference, between a join operation and a relate operation.
“Containment” is a topological relationship that can be used in spatial join. Provide an example from your discipline that shows how it can be used.
Describe two ways of creating new attributes from the existing attributes in a data set.
Name five common elements on a map for presentation.
Why is it important to pay attention to map design?
Mapmakers apply visual variables to map symbols. What are visual variables?
Name common visual variables for data display.
Describe the three visual dimensions of color.
Use an example to describe a “hue and value”color scheme.
Use an example to describe a “diverging” color scheme.
Define the choropleth map.
Why is data classification important in mapping, especially in choropleth mapping?
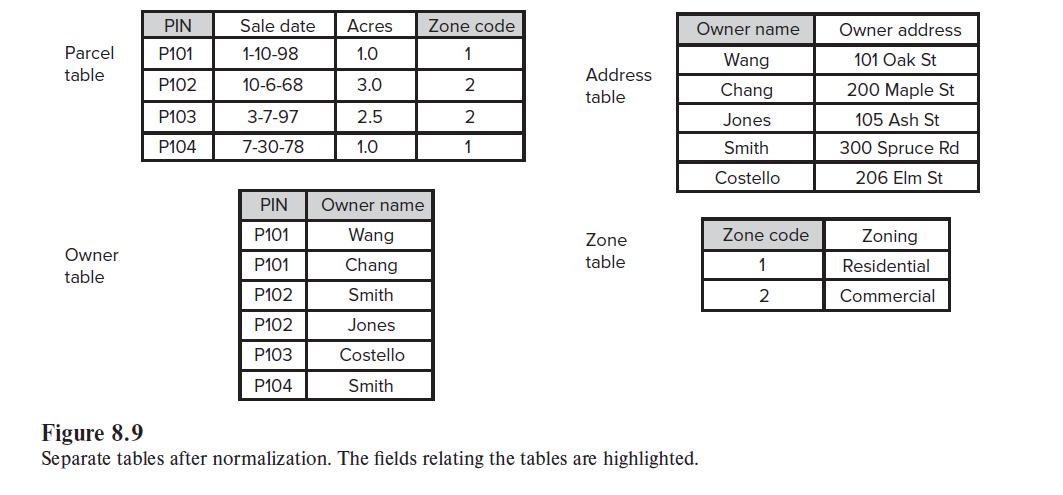
Suppose you are asked to redo Figure 9.10. Provide a list of type designs, including typeface, form, and size, that you will use for the four classes of cities. Major Cities in Idaho Coeur d'Alene Moscow Lewiston Caldwell Boise Nampa Twin Falls City
ArcGIS offers the display options of graduated colors and graduated symbols. How do these two options differ?
What are the general rules for achieving harmony with text on a map?
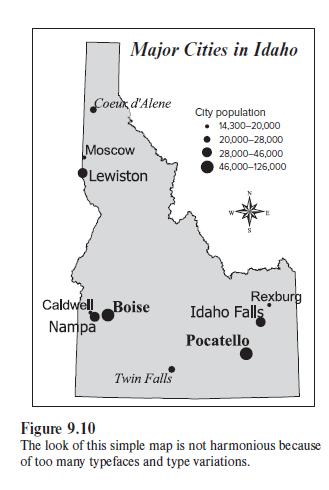
Figure 9.16 shows a layout template available in ArcGIS for the conterminous USA. Will you consider using the layout template for future projects? Why, or why not? Rate of Change by State 200 -57-0.0 0.1-10.0 Figure 9.16 101-20.0 20.1-30.0 30.1-66.3 Population Change in the United States,
ArcGIS offers interactive labeling and dynamic labeling for the placement of text. What are the advantages and disadvantages of each labeling method?
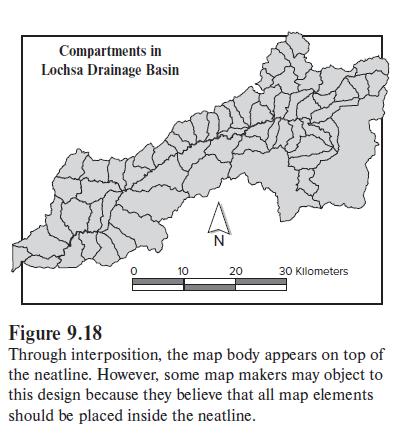
Figure 9.18 shows an example of using interposition in map design. Does the map achieve the intended 3-D effect? Will you consider using it? Compartments in Lochsa Drainage Basin 0 10 N 20 30 Kilometers Figure 9.18 Through interposition, the map body appears on top of the neatline. However, some
What is visual hierarchy in map design? How is the hierarchy related to the map purpose?
What is subdivisional organization in map design? Can you think of an example, other than the climate map example in Chapter 9, to which you can apply the principle?
Explain why color symbols from a color printer do not exactly match those on the computer screen.
Define the RGB and CMYK color models.
Describe an example from your discipline in which temporal animation can be used as a display tool.
Give an example of data exploration from your own experience.
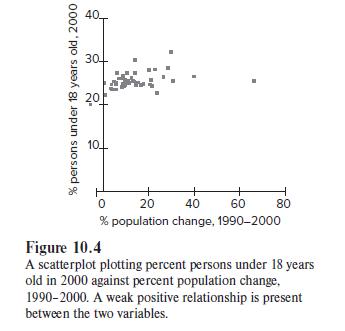
Figure 10.4 exhibits a weak positive relationship between % population change, 1990–2000 and % persons under 18 years old, 2000. What does a positive relationship mean in this case? % persons under 18 years old, 2000 40. 304 20 10 0 20 40 60 % population change, 1990-2000 80 Figure 10.4 A
Download % population change by county for your state between 2000 and 2010. (You can get the data from the Population Distribution and Change: 2010 link on the 2010 Census Briefs Web page, https://www.census.gov/2010census/news/press-kits/briefs/briefs.html.)Use the data to compute the median,
Use the county data and descriptive statistics from Question 2 to draw a boxplot. What kind of data distribution does the boxplot show?Question 2Download % population change by county for your state between 2000 and 2010. (You can get the data from the Population Distribution and Change: 2010 link
Describe brushing as a technique for data exploration.
Describe an example of using spatial aggregation for data exploration.
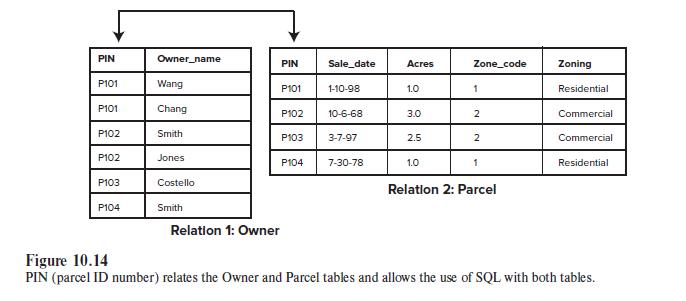
Refer to Figure 10.14, and write an SQL statement to query the owner name of parcel P104. PIN P101 P101 P102 P102 P103 P104 Owner_name Wang Chang Smith Jones Costello Smith PIN P101 P102 P103 P104 Relation 1:
What is a bivariate choropleth map?
Refer to Figure 10.14, and write an SQL statement to query the owner name of parcel P103 OR parcel P104. PIN P101 P101 P102 P102 P103 P104 Owner_name Wang Chang Smith Jones Costello Smith PIN P101 P102 P103 P104 Relation 1:
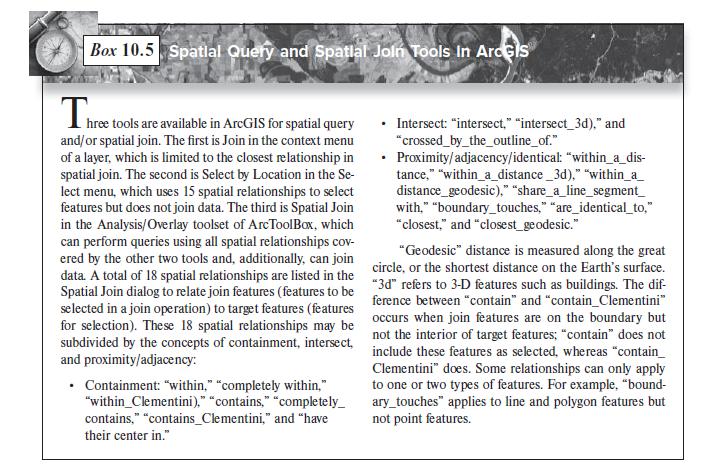
Refer to Box 10.5, and describe an example of using “intersect” for spatial data query. Box 10.5 Spatial Query and Spatial Join Tools In ArcGis Th hree tools are available in ArcGIS for spatial query and/or spatial join. The first is Join in the context menu of a layer, which is limited to the
Refer to Box 10.5, and describe an example of using “are contained by” for spatial data query. Box 10.5 Spatial Query and Spatial Join Tools In ArcGis Th hree tools are available in ArcGIS for spatial query and/or spatial join. The first is Join in the context menu of a layer, which is limited
Define spatial data query.
Explain the difference between the tools of Selection by Location and Spatial Join in ArcGIS.
Can you think of another solution for Question 14?Question 14Refer to Box 10.5, and describe an example of using “intersect” for spatial data query. Box 10.5 Spatial Query and Spatial Join Tools In ArcGIs Th hree tools are available in ArcGIS for spatial query and/or spatial join. The first is
You are given two digital maps of New York City: one shows landmarks, and the other shows restaurants. One of the attributes of the restaurant layer lists the type of food (e.g., Japanese, Italian, etc.). Suppose you want to find a Japanese restaurant within 2 miles of Times Square. Describe the
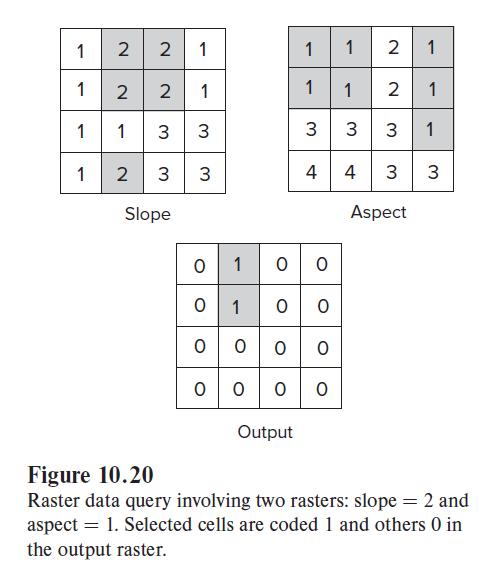
Refer to Figure 10.20. If the query statement is ([slope] = 1) AND ([aspect] = 3), how many cells in the output will have the cell value of 1? 1 1 1 1 2 2 1 2 1 1 2 2 33 3 3 Slope 0 0 1 1 0 0 100 Output ooo 0 0 0 0 0 1 1 1 3 3 3 4 4 3 Aspect 2 1 2 1 1 3 Figure 10.20 Raster data query involving two
Define a buffer zone.
Describe three variations in buffering.
Provide an application example of buffering from your discipline.
Describe a point-in-polygon overlay operation.
A line-in-polygon operation produces a line layer, which typically has more records (features) than the input line layer. Why?
Provide an example of a polygon-on-polygon overlay operation from your discipline.
Describe a scenario in which Intersect is preferred over Union for an overlay operation.
Suppose the input layer shows a county and the overlay layer shows a national forest. Part of the county overlaps the national forest. We can express the output of an Intersect operation as [county] AND [national forest]. How can you express the outputs of a Union operation and an Identity
Define slivers from an overlay operation.
What is a minimum mapping unit? How can a minimum mapping unit be used to deal with the sliver problem?
Although many slivers from an overlay operation represent inaccuracies in the digitized boundaries, they can also represent the inaccuracies of attribute data (i.e., identification errors). Provide an example for the latter case.
Explain the areal interpolation problem by using an example from your discipline.
Both nearest neighbor analysis and Moran’s I can apply to point features. How do they differ in terms of input data?
Explain spatial autocorrelation in your own words.
Both Moran’s I and the G-statistic have the global (general) and local versions. How do these two versions differ in terms of pattern analysis?
The local G-statistic can be used as a tool for hot spot analysis. Why?
What does a Dissolve operation accomplish?
Suppose you have downloaded a vegetation map from the Internet. But the map is much larger than your study area. Describe the steps you will follow to get the vegetation map for your study area.
Suppose you need a map showing toxic waste sites in your county. You have downloaded a shapefile from the Environmental Protection Agency (EPA) website that shows toxic waste sites in every county of your state. What kind of operation will you use on the EPA map so that you can get only the county
How can an analysis mask save time and effort for raster data operations?
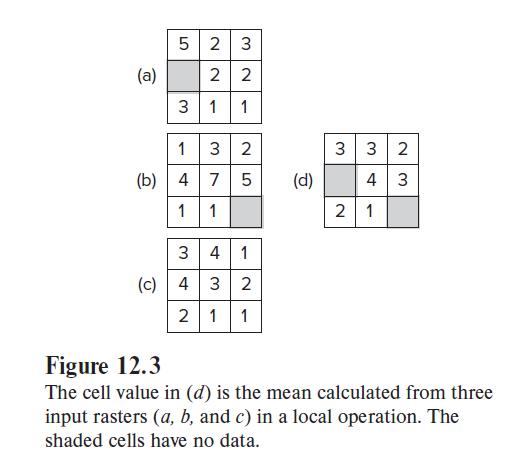
Refer to Figure 12.3. Show the output raster if the local operation uses the minimum statistic. (a) 2 3 2 2 3 1 1 5 1 3 2 5 (b) 47 1 1 3 4 1 (c) 4 3 2 2 1 1 (d) 3 3 2 4 3 21 Figure 12.3 The cell value in (d) is the mean calculated from three input rasters (a, b, and c) in a local operation.
Why is a local operation also called a cell-by-cell operation?
Showing 100 - 200
of 312
1
2
3
4
Step by Step Answers