New Semester
Started
Get
50% OFF
Study Help!
--h --m --s
Claim Now
Question Answers
Textbooks
Find textbooks, questions and answers
Oops, something went wrong!
Change your search query and then try again
S
Books
FREE
Study Help
Expert Questions
Accounting
General Management
Mathematics
Finance
Organizational Behaviour
Law
Physics
Operating System
Management Leadership
Sociology
Programming
Marketing
Database
Computer Network
Economics
Textbooks Solutions
Accounting
Managerial Accounting
Management Leadership
Cost Accounting
Statistics
Business Law
Corporate Finance
Finance
Economics
Auditing
Tutors
Online Tutors
Find a Tutor
Hire a Tutor
Become a Tutor
AI Tutor
AI Study Planner
NEW
Sell Books
Search
Search
Sign In
Register
study help
sciences
introduction to geographic information
Introduction To Geographic Information Systems 9th Edition Kang-tsung Chang - Solutions
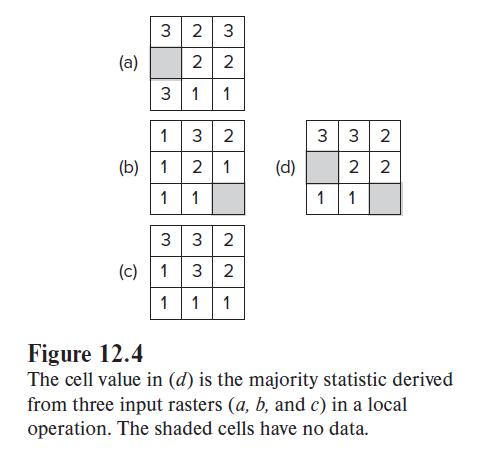
Refer to Figure 12.4. Show the output raster if the local operation uses the variety statistic. (a) 3 2 3 2 2 3 1 1 1 (b) 1 3 2 1 2 1 1 3 3 2 (c) 1 3 2 1 1 1 (d) 3 3 2 2 2 1 1 Figure 12.4 The cell value in (d) is the majority statistic derived from three input rasters (a, b, and c) in a
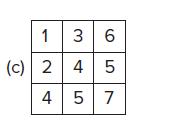
Figure 12.5c has two cells with the same value of 4. Why?Figure 12.5c 1 3 6 (c)24 4 5 4 5 7
Neighborhood operations are also called focal operations. What is a focal cell?
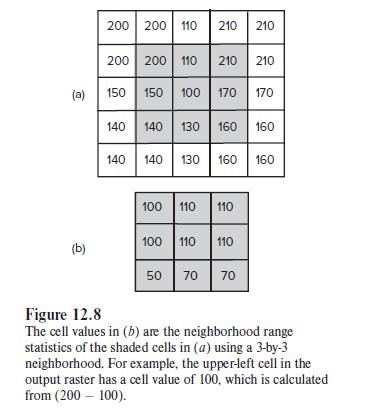
Refer to Figure 12.8. Show the output raster if the neighborhood operation uses the variety measure. (a) (b) 200 200 110 210 210 200 200 110 210 210 150 150 100 170 170 140 140 130 160 140 140 130 160 160 100 110 110 100 110 110 160 50 70 70 Figure 12.8 The cell values in (b) are the neighborhood
Describe the common types of neighborhoods used in neighborhood operations.
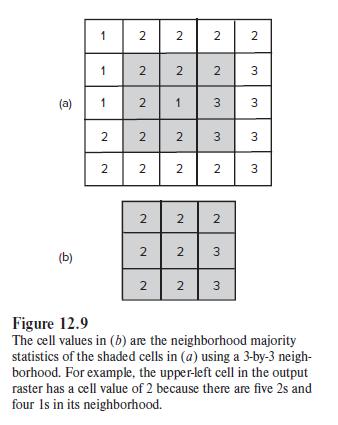
Refer to Figure 12.9. Show the output raster if the neighborhood operation uses the minority statistic. (a) (b) 1 1 1 2 2 2 2 2 2 2 2 2 2 2 2 1 2 2 2 2 2 2 3 3 2 2 3 3 2 2 3 ليا 3 3 3 Figure 12.9 The cell values in (b) are the neighborhood majority statistics of the shaded cells in (a) using a
What kinds of geometric measures can be derived from zonal operations on a single raster?
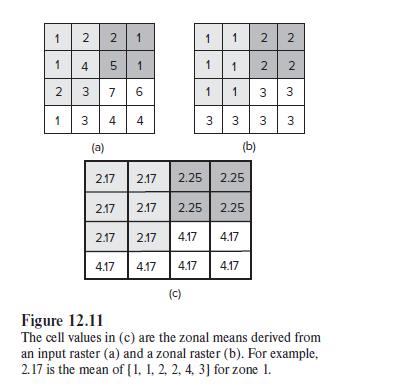
Refer to Figure 12.11. Show the output raster if the zonal operation uses the range statistic. 1 1 2 1 2 2 4 5 3 3 (a) 1 7 6 4 4 1 220 2.17 2.17 2.17 2.17 4.17 4.17 1 1 1 (C) 3 1 1 1 3 (b) 2.25 2.25 2.17 2.25 2.25 2.17 4.17 4.17 4.17 4.17 2 2 2 2 3 3 3 3 Figure 12.11 The cell values in (c) are the
A zonal operation with two rasters must define one of them as the zonal raster first. What is a zonal raster?
Suppose you are asked to produce a raster that shows the average precipitation in each major watershed in your state. Describe the procedure you will follow to complete the task.
Explain the difference between the physical distance and the cost distance.
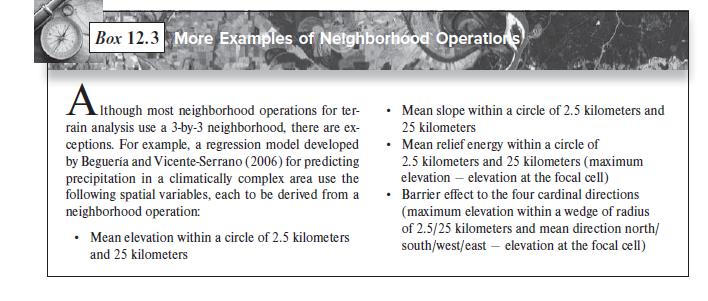
Refer to Box 12.3. Suppose that you are given an elevation raster. How can you prepare a raster showing mean relief energy within a circle of 2.5 kilometers? Box 12.3 More Examples of Neighborhood Operations Although Ithough most neighborhood operations for ter- rain analysis use a 3-by-3
What is a physical distance measure operation?
A government agency will most likely use a vector-based buffering operation, rather than a raster-based physical distance measure operation, to define a riparian zone. Why?
Write a map algebra expression that will select areas with elevations higher than 3000 feet from an elevation raster (emidalat), which is measured in meters.
List the types of data that can be used to compile an initial TIN.
List the types of data that can be used to modify a TIN.
The maximum z-tolerance algorithm is an algorithm used by ArcGIS for converting a DEM into a TIN. Explain how the algorithm works.
Suppose you are given a DEM to make a contour map. The elevation readings in the DEM range from 856 to 1324 meters. If you were to use 900 as the base contour and 100 as the contour interval, what contour lines would be on the map?
Describe factors that can influence the visual effect of hill shading.
Explain how the viewing azimuth, viewing angle, viewing distance, and z-scale can change a 3-D perspective view.
Describe in your own words (no equation) how a computing algorithm derives the slope of the center cell by using elevations of its four immediate neighbors.
Describe in your own words how ArcGIS derives the slope of the center cell by using elevations of its eight surrounding neighbors.
What factors can influence the accuracy of slope and aspect measures from a DEM?
Suppose you need to convert a raster from degree slope to percent slope. How can you complete the task in ArcGIS?
Suppose you have a polygon layer with a field showing degree slope. What kind of data processing do you have to perform in ArcGIS so that you can use the polygon layer in percent slope?
What are the advantages of using an elevation raster for terrain mapping and analysis?
What are the advantages of using a TIN for terrain mapping and analysis?
Describe the two types of input data required for viewshed analysis.
What is a cumulative viewshed map?
Some researchers have advocated probabilistic visibility maps. Why?
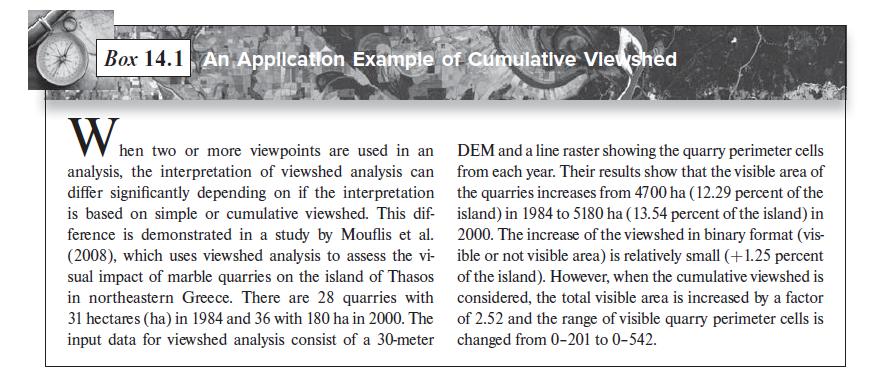
Box 14.1 describes an application example of cumulative watershed. Which operation, counting or Boolean, did the study use for compiling the cumulative watershed? Box 14.1 An Application Example of Cumulative Viewshed Wh hen two or more viewpoints are used in an analysis, the interpretation of
What parameters can we choose for viewshed analysis?
Suppose you are asked by the U.S. Forest Service to run viewshed analysis along a scenic highway. You have chosen a number of points along the highway as viewpoints. You want to limit the view to within 2 miles from the highway and within a horizontal viewing angle from due west to due east. What
Besides the examples cited in Chapter 14, could you think of another viewshed application from your discipline?
Draw a diagram that shows the elements of watershed, topographic divide, stream section, stream junction, and outlet.
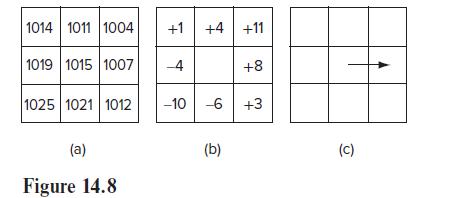
The example in Figure 14.8 shows an eastward flow direction. Suppose the elevation of the lower-left cell is changed from 1025 to 1028.Will the flow direction remain the same? 1014 1011 1004 +1 +4 +11 1019 1015 1007 1025 1021 1012 (a) Figure 14.8 -4 -10 -6 (b) +8 +3 (C)
What is a filled DEM? Why is a filled DEM needed for a watershed analysis?
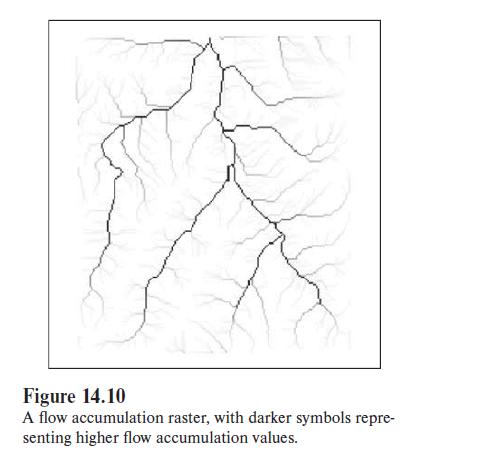
How do you interpret a flow accumulation raster (Figure 14.10)? Figure 14.10 A flow accumulation raster, with darker symbols repre- senting higher flow accumulation values.
What kinds of criticisms has the D8 method received?
Deriving a drainage network from a flow accumulation raster requires the use of a channel initiation threshold value. Explain how the threshold value can alter the outcome of the drainage network.
To generate areawide watersheds from a DEM, we must create several intermediate rasters.Draw a flow chart that starts with a DEM, followed by the intermediate rasters, and ends with a watershed raster.
A watershed identified for a pour point is often described as a merged watershed. Why?
Describe the effect of DEM resolution on watershed boundary delineation.
Explain the difference between D8 and D∞ in calculation of flow direction.
Describe an application example of watershed analysis in your discipline.
What is spatial interpolation?
What kinds of inputs are required for spatial interpolation?
Explain the difference between a global method and a local method.
How does an exact interpolation method differ from an inexact interpolation method?
What are Thiessen polygons?
Given a sample size of 12, illustrate the difference between a sampling method that uses the closest points and a quadrant sampling method.
Describe how cell densities are derived using the kernel density estimation method.
The power k in inverse distance weighted interpolation determines the rate of change in values from the sample points. Can you think of a spatial phenomenon that should be interpolated with a k value of 2 or higher?
Describe how the semivariance can be used to quantify the spatial dependence in a data set.
Binning is a process for creating a usable semivariogram from empirical data. Describe how binning is performed.
A semivariogram must be fitted with a mathematical model before it can be used in kriging. Why?
Both IDW and kriging use weights in estimating an unknown value. Describe the difference between the two interpolation methods in terms of derivation of the weights.
Explain the main difference between ordinary kriging and universal kriging.
The RMS statistic is commonly used for selecting an optimal interpolation method. What does the RMS statistic measure?
Explain how one can use the validation technique for comparing different interpolation methods.
Which local interpolation method can usually give you a smooth isoline map?
Describe the two required inputs for address geocoding.
List attributes in the TIGER/Line files that are important for geocoding.
Go to the MapQuest website (http://www .mapquest.com/). Type the street address of your bank for search. Does it work correctly?
Explain linear interpolation as a process for plotting an address along a street segment.
Describe the three phases of the address geocoding process.
What address matching options are usually available in a GIS package?
What factors can cause low hit rates in address geocoding?
Explain the difference between the side offset and end offset options in geocoding.
What is ZIP code geocoding?
What is photo geocoding?
Geocoding is one of the most commercialized GIS-related activities. Can you think of a commercial application example of geo-coding besides those that have already been mentioned in Chapter 16?
Explain in your own words how events are located along a route using dynamic segmentation.
Explain how a route’s linear measure system is stored in the geodatabase.
Describe methods for creating routes from existing linear features.
How can you tell a point event table from a line event table?
Suppose you are asked to prepare an event table that shows portions of Interstate 5 in California crossing earthquake-prone zones (polygon features). How can you complete the task?
Check whether the transportation department in your state maintains a website for distributing GIS data. If it does, what kinds of data are available for dynamic segmentation applications?
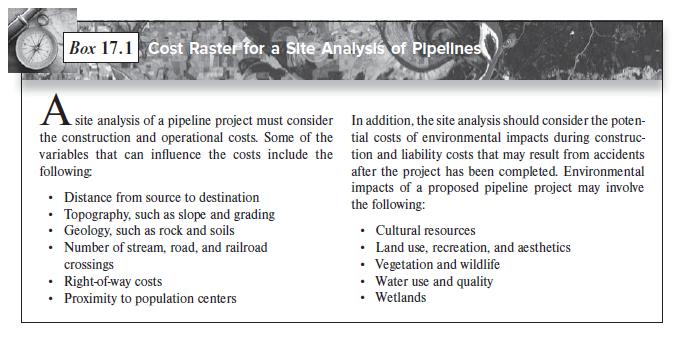
Box 17.1 summarizes the various costs for a pipeline project. Use Box 17.1 as a reference and list the types of costs that can be associated with a new road project. A site analysis of a pipeline project must consider In addition, the site analysis should consider the poten- the construction and
What is a source raster for least-cost path analysis?
Define a cost raster.
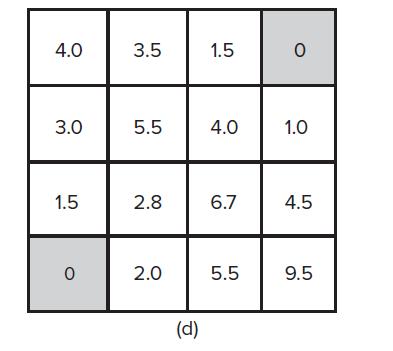
Refer to Figure 17.4d. Explain how the cell value of 5.5 (row 2, column 2) is derived. Is it the least accumulative cost? 4.0 3.0 1.5 0 3.5 5.5 2.0 1.5 (d) 4.0 2.8 6.7 4.5 0 5.5 1.0 9.5
Refer to Figure 17.4d. Show the least accumulative cost path for the cell at row 2, column 3. 4.0 3.0 1.5 0 3.5 5.5 2.0 1.5 (d) 4.0 2.8 6.7 4.5 0 5.5 1.0 9.5
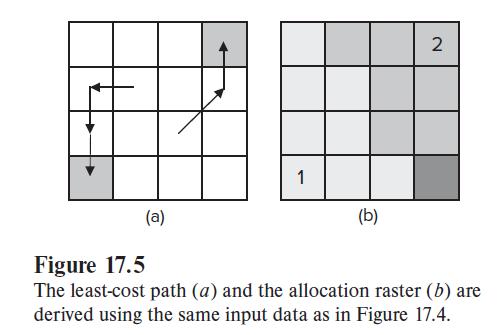
Refer to Figure 17.5. The cell at row 4, column 4 can be assigned to either one of the two source cells. Show the least-cost path from the cell to each source cell. (a) 1 (b) 2 Figure 17.5 The least-cost path (a) and the allocation raster (b) are derived using the same input data as in Figure 17.4.
What is an allocation raster?
How does the surface distance differ from the regular (planimetric) cost distance?
Explain the difference between a network and a line shapefile.
What is link impedance?
What is turn impedance?
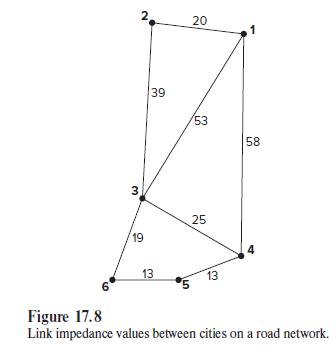
Suppose the impedance value between nodes 1 and 4 is changed from 58 to 40 (e.g., because of lane widening) in Figure 17.8. Will it change the result in Table 17.2? 6 3 19 39 13 20 53 25 13 58 4 Figure 17.8 Link impedance values between cities on a road network.
What are considered restrictions in network analysis?
The result of an allocation analysis is typically presented as service areas. Why?
Define location–allocation analysis.
Explain the difference between the minimum distance model and the maximum covering model in location–allocation analysis.
Describe the difference between a descriptive model and a prescriptive model.
How does a static model differ from a dynamic model?
Describe the basic steps involved in the modeling process.
Suppose you use kriging to build an interpolation model. How do you calibrate the model?
In many instances, you can build a GIS model that is either vector-based or raster-based. What general guidelines should you use in deciding which model to build?
Showing 200 - 300
of 312
1
2
3
4
Step by Step Answers