

Question: For the data given in Table 1.8, draw the scatterplots of the following variables and discuss your conclusions: a. No-shows and overtime b. Medical errors
For the data given in Table 1.8, draw the scatterplots of the following variables and discuss your conclusions:
a. No-shows and overtime
b. Medical errors and billing errors
c. Overtime and billing errors
Table 1.8:
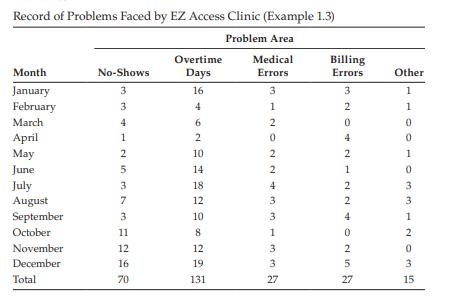
Record of Problems Faced by EZ Access Clinic (Example 1.3) Problem Area Month January February March April May June July August September October November December Total No-Shows 3 2 3 4 N 10 1731 1 2 5 11 12 16 70 Overtime Days 16 4 Na 2 10 14 18 12 10 8 12 19 131 Medical Errors 3 1 333WW+NNONL 2 0 2 2 4 1 27 Billing Errors 3 2 0 2 1 2 2 4 0 2 5 27 Other 1 1000 OM MINOM H 0 3 3 1 2 0 3 15
Step by Step Solution
3.46 Rating (162 Votes )
There are 3 Steps involved in it

Get step-by-step solutions from verified subject matter experts