

Question: Obtain closing data and compute daily returns for the full year 2017 for FSLR. (a) Produce four q-q plots of the sample of FSLR larger
Obtain closing data and compute daily returns for the full year 2017 for FSLR.
(a) Produce four q-q plots of the sample of FSLR larger than the 0.9 quantile with respect to four different reference distributions as in Exercise 2.16; a t with 100 degrees of freedom, a t with 20 degrees of freedom, a \(t\) with 5 degrees of freedom, and a \(t\) with 3 degrees of freedom.
(b) Produce four q-q plots of the sample of FSLR smaller than the 0.1 quantile with respect to the four different reference distributions in Exercise 2.17a.
(c) Use the qplot function in the evir package to produce q-q plots of the FSLR data with standard location-scale generalized Pareto distributions as the reference distribution.
Make two q-q plots with the (lower) threshold at the 0.9 sample quantile. For one plot, use the exponential as the reference distribution \((\xi=0)\), and for the other, use \(\xi=0.5\) in the generalized Pareto distribution.
Now make two q-q plots using the same reference distributions and an upper threshold at the 0.1 quantile; that is, lower \(10 \%\) of the data. Note that the data are from the left side of a distribution more-or-less symmetric about zero.
Data From Exercise 2.16:
Obtain closing data and compute daily returns for the full year 2017 for FSLR.
Produce four q-q plots with respect to four different reference distributions; a t with 100 degrees of freedom, a t with 20 degrees of freedom, a t with 5 degrees of freedom, and a t with 3 degrees of freedom, as in Figure 2.10.
Comment on the q-q plots. Is there anything unusual? If so, explore the data further.
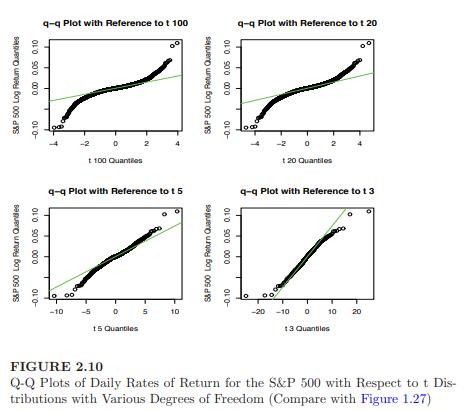
S&P 500 Log Retum Quantiles -0.10 0.00 0.05 0.10 S&P 500 Log Return Quantes -0.10 0.00 0.05 0.10 q-q Plot with Reference to t 100 t 100 Quantiles q-q Plot with Reference to t 5 -10 -5 0 5 15 Quantiles 10 10 S&P 500 Log Retum Quantiles -0.10 0.00 0.05 0.10 S&P 500 Log Return Quanties -0.10 0.00 0.05 0.10 q-q Plot with Reference to t 20 -2 02 120 Quantiles q-q Plot with Reference to 13 -20 -10 0 10 20 13 Quantiles FIGURE 2.10 Q-Q Plots of Daily Rates of Return for the S&P 500 with Respect to t Dis- tributions with Various Degrees of Freedom (Compare with Figure 1.27)
Step by Step Solution
There are 3 Steps involved in it

Get step-by-step solutions from verified subject matter experts