

Question: Obtain closing data and compute daily returns for the full year 2017 for FSLR. Produce four q-q plots with respect to four different reference distributions;
Obtain closing data and compute daily returns for the full year 2017 for FSLR.
Produce four q-q plots with respect to four different reference distributions; a t with 100 degrees of freedom, a t with 20 degrees of freedom, a t with 5 degrees of freedom, and a t with 3 degrees of freedom, as in Figure 2.10.
Comment on the q-q plots. Is there anything unusual? If so, explore the data further.
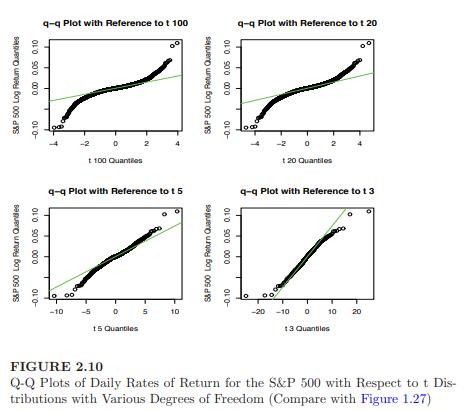
S&P 500 Log Retum Quantiles -0.10 0.00 0.05 0.10 S&P 500 Log Return Quantes -0.10 0.00 0.05 0.10 q-q Plot with Reference to t 100 t 100 Quantiles q-q Plot with Reference to t 5 -10 -5 0 5 15 Quantiles 10 10 S&P 500 Log Retum Quantiles -0.10 0.00 0.05 0.10 S&P 500 Log Return Quanties -0.10 0.00 0.05 0.10 q-q Plot with Reference to t 20 -2 02 120 Quantiles q-q Plot with Reference to 13 -20 -10 0 10 20 13 Quantiles FIGURE 2.10 Q-Q Plots of Daily Rates of Return for the S&P 500 with Respect to t Dis- tributions with Various Degrees of Freedom (Compare with Figure 1.27)
Step by Step Solution
There are 3 Steps involved in it

Get step-by-step solutions from verified subject matter experts