

Question: For the Houses data file (shown partly in Table 9.5), Table 9.12 shows a regression analysis relating selling price to number of bedrooms. (a) Report
For the Houses data file (shown partly in Table 9.5), Table 9.12 shows a regression analysis relating selling price to number of bedrooms.
(a) Report the prediction equation, and interpret the slope.
(b) Report r2, and interpret its value.
(c) Report the correlation and its confidence interval, and interpret.
(d) Interpret the value labeled Root MSE.
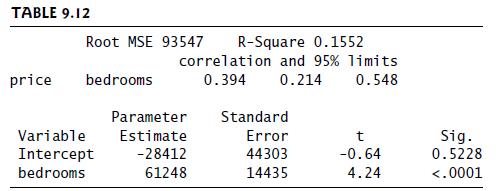
TABLE 9.12 Root MSE 93547 R-Square 0.1552 correlation and 95% limits price bedrooms 0.394 0.214 0.548 Parameter Standard Variable Estimate Error t Sig. Intercept -28412 44303 -0.64 0.5228 bedrooms 61248 14435 4.24
Step by Step Solution
There are 3 Steps involved in it
1 Expert Approved Answer
Step: 1 Unlock

Question Has Been Solved by an Expert!
Get step-by-step solutions from verified subject matter experts
Step: 2 Unlock
Step: 3 Unlock