

Question: Refer to the previous exercise. Using software with the Florida data file at the text website, (a) Construct box plots for each variable and scatterplots
Refer to the previous exercise. Using software with the Florida data file at the text website,
(a) Construct box plots for each variable and scatterplots and partial regression plots between y and each of x1 and x2. Interpret these plots.
(b) Find the prediction equations for the (i) bivariate effects of x1 and of x2, (ii) multiple regression model. Interpret the estimated regression coefficients.
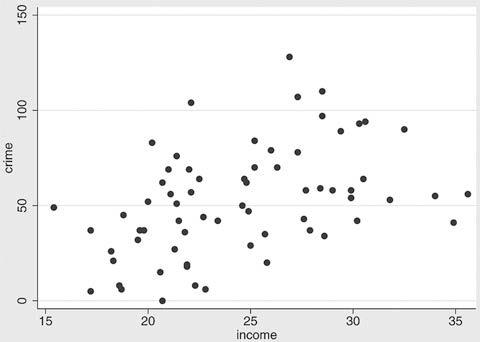
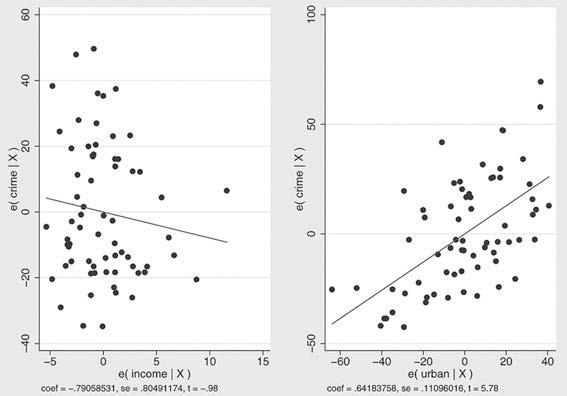
TABLE 11.13 BIVARIATE Coef. Std. Err. t P>|t|
income 2.609 0.675 3.866 0.0003 _cons -11.526 16.834 -0.685 0.4960 MULTIPLE Coef. Std. Err. t P>|t|
income -0.809 0.805 -1.005 0.3189 urban 0.646 0.111 5.811 0.0001 _cons 40.261 16.365 2.460 0.0166
(c) Find R2 for the multiple regression model, and show that it is not much larger than r2 for the model using urbanization alone as the predictor. Interpret.
10 150 crime 100 10 50 50 0 15 20 25 30 35 income
Step by Step Solution
There are 3 Steps involved in it

Get step-by-step solutions from verified subject matter experts