

Question: Access the Sampling Distribution of the Sample Proportion web app. a. For p = 0.5 and a sample of size n = 3, the graph
Access the Sampling Distribution of the Sample Proportion web app.
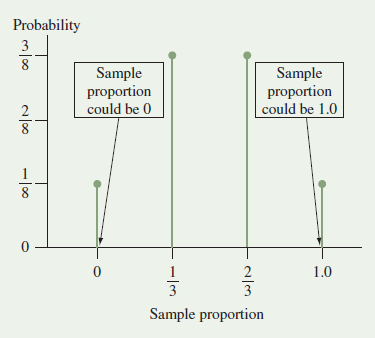
a. For p = 0.5 and a sample of size n = 3, the graph of the sampling distribution is given below. (This is the graph corresponding to the table in Exercise 7.49, part b.) Compute the mean of the sampling distribution from first principles, i.e., using the formula gxP1X = x2. The standard deviation of the sampling distribution is equal to 0.289.
b. Now, using the app, simulate the sampling distribution for a population proportion when p = 0.5 and n = 3, using 10,000 simulations. Do the graph and the results from the simulations agree? Compare the shapes, means, and standard deviations from the two graphs. (The mean and standard deviation of the 10,000 generated sample proportions are displayed in the title of the graph for the sampling distribution in the app.)
Probability 3 Sample proportion could be 0 Sample proportion could be 1.0 1.0 Sample proportion 2/3 -l3 -l00
Step by Step Solution
3.37 Rating (172 Votes )
There are 3 Steps involved in it
a The mean of the sampling distribution is 018 13... View full answer

Get step-by-step solutions from verified subject matter experts
Document Format (2 attachments)
1544_605d88e208e01_676264.pdf
180 KBs PDF File
1544_605d88e208e01_676264.docx
120 KBs Word File