

Refer to the previous two exercises but now suppose the population proportion in Boston preferring pizza A
Question:
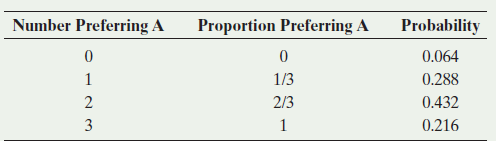
a. Use the binomial distribution to verify that the sampling distribution of the sample proportion in a sample of size n = 3 is given by
b. When n = 100, what is the mean number of persons that prefer pizza A in a sample of size n = 100?
c. Part b found the mean number (or expected value) of persons preferring pizza A in a sample of size 100. What then is the expected proportion of persons preferring pizza A in a sample of size 100? This is the mean of the sampling distribution of the sample proportion.
The word "distribution" has several meanings in the financial world, most of them pertaining to the payment of assets from a fund, account, or individual security to an investor or beneficiary. Retirement account distributions are among the most...
Fantastic news! We've Found the answer you've been seeking!
Step by Step Answer:
a Let X the number of people out of 3 that prefer piz...View the full answer

Answered By
Saleem Abbas
Have worked in academic writing for an a years as my part-time job.
1+ Reviews
10+ Question Solved
Related Book For 

Statistics The Art And Science Of Learning From Data
ISBN: 9780321997838
4th Edition
Authors: Alan Agresti, Christine A. Franklin, Bernhard Klingenberg
Question Posted:
