

Consider the variable average ticket sale in the Home Depot data presented here. This variable indicates, for
Question:
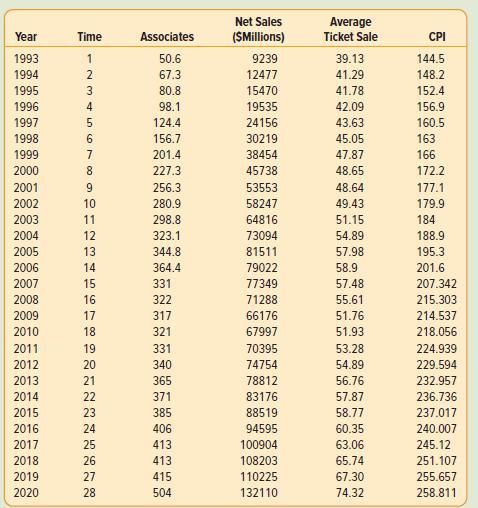
Consider the variable average ticket sale in the Home Depot data presented here. This variable indicates, for example, that customers spent an average of $39.13 on goods during a store visit in 1993. By 2020 this amount increased to $74.32. During that same period the CPI as reported by the Bureau of Labor Statistics increased from 144.5 to 258.811. Convert the CPI to a 1993 base, as described on page 657 in Chapter 17 and convert the average ticket sale to 1993 dollars. Develop a linear trend equation for the constant 1993 dollars of the average ticket sale. Is it reasonable that the trend is linear? Can we conclude that the value of the amount the customer spent is less?
You will need the help of a software package such as Excel and perhaps a companion package such as MegaStat. For the years 1993 through 2020, the data include a coded time variable (1 through 26), the number of associates in thousands, net sales in millions of dollars, the average ticket sale, and the Consumer Price Index (CPI) for each year.
Step by Step Answer:
Convert CPI to a 1993 Base The CPI in a base year is always 100 To convert the CPI to a 1993 base yo...View the full answer


Statistical Techniques In Business And Economics
ISBN: 9781265779696
19th Edition
Authors: Douglas Lind, William Marchal, Samuel Wathen
