

Question: Obtain the sensitivity curves for the sample mean, the sample median and the HodgesLehmann estimator for the following data set. Evaluate the curves at the
Obtain the sensitivity curves for the sample mean, the sample median and the Hodges–Lehmann estimator for the following data set. Evaluate the curves at the values −300 to 300 in increments of 10 and graph the curves on the same plot. Compare the sensitivity curves.
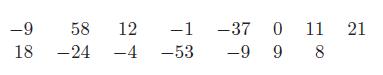
-9 58 12 -1 18 -24 -4 -53 -37 0 11 21 -9 9 8
Step by Step Solution
★★★★★
3.40 Rating (163 Votes )
There are 3 Steps involved in it
1 Expert Approved Answer
Step: 1 Unlock

In general if we consider sampling from a distribution with mean then the sample mean is given ... View full answer
Question Has Been Solved by an Expert!
Get step-by-step solutions from verified subject matter experts
Step: 2 Unlock
Step: 3 Unlock