

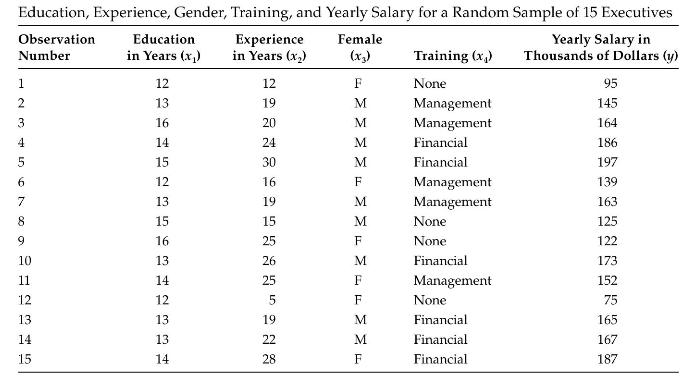
The data set in Table 2.11 provides the yearly salaries (in thousands) for a sample of 15
Question:
The data set in Table 2.11 provides the yearly salaries (in thousands) for a sample of 15 executives by education, experience, gender, and type of management training (no training, management training, or financial training).
a. Create a bar chart that shows the frequency of the sample based on gender.
b. Using the Cluster option, draw a bar chart that shows the frequency of the sample based on type of management training and gender. This can be done by entering the categorical variables of gender and type of training in the categorical variables box.
Table 2.11
Step by Step Answer:

This question has not been answered yet.
You can Ask your question!
Related Book For 

Question Posted:
