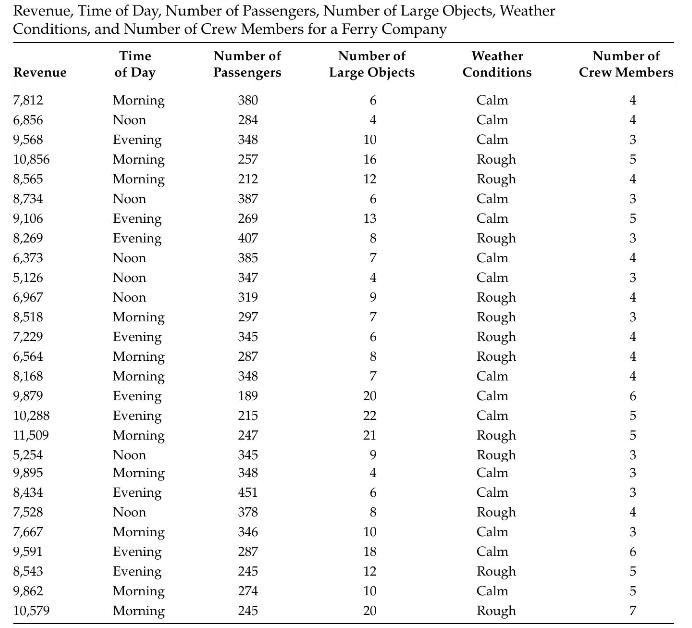
The data set in Table 2.12 consists of a selection of variables for a ferry company that
Question:
The data set in Table 2.12 consists of a selection of variables for a ferry company that describe the revenue, time of day the ferry left the dock, number of passengers on the ferry, number of large objects on the ferry, the weather conditions, and the number of crew for a random sample of 27 ferry runs over the course of a month.
a. Create a stem-and-leaf plot for the number of passengers.
b. Create a bar graph that illustrates the number of ferry trips based on the time of day.
c. Create a bar graph that illustrates the number of ferry runs based on the weather conditions.
d. Create a boxplot for the number of large objects carried on the ferry.
e. Create a matrix plot of revenue versus number of passengers and the number of large objects.
Table 2.12
Step by Step Answer:

This question has not been answered yet.
You can Ask your question!