

The following data report total, monthly, U.S. new car sales in millions of dollarsfrom January 2016 to
Question:
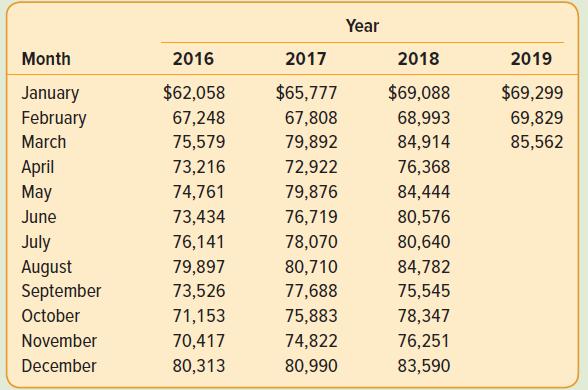
The following data report total, monthly, U.S. new car sales in millions of dollarsfrom January 2016 to March 2019. (To find the data, go to https://www.census.gov/ retail/index.html#mrts, find “Monthly Retail Trade Report,” then select “Time Series/ Trend Charts.”)
a. G raph the data.
b. Based on the graph, describe the time series pattern.
c. For this time series, why is forecasting with a seasonally adjusted trend model appropriate?
d. What is the average monthly trend in new car sales?
e. E valuate a seasonally adjusted trend forecasting model. What is the MAD?
f. What are the monthly seasonal indexes? When are new car sales the highest? When are new car sales the lowest?
g. Forecast new car sales with error for the next 9 months.
h. In your judgment, are the forecasts “good”? What disclaimer would you include with your forecast?
Step by Step Answer:
a b The time series has definite seasonality with peaks occurring in the December followed by low sa...View the full answer


Statistical Techniques In Business And Economics
ISBN: 9781260239478
18th Edition
Authors: Douglas Lind, William Marchal, Samuel Wathen
