

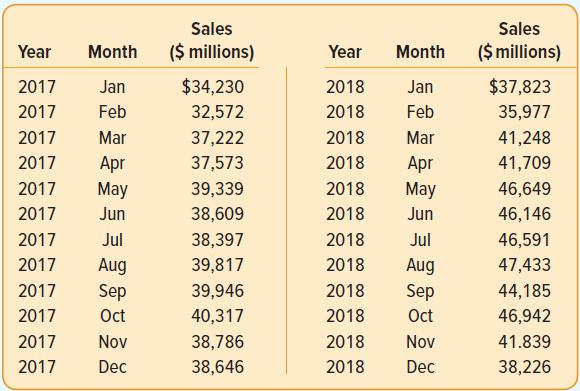
The following data report total, monthly U.S. gasoline sales in millions of dollars from January 2017 to
Question:
The following data report total, monthly U.S. gasoline sales in millions of dollars from January 2017 to December 2018. (To find the data, go to the site https:// www.census.gov/retail/index.html#mrts, find “Monthly Retail Trade Report,” then select “Time Series/Trend Charts.”)
a. G raph the data.
b. Based on the graph, describe the time series pattern.
c. For this time series, why is forecasting with a seasonally adjusted trend model appropriate?
d. E valuate a seasonally adjusted trend forecasting model. What is the MAD?
e. What are the monthly indexes?
f. Forecast sales for January, February, March, and April of 2019.
Fantastic news! We've Found the answer you've been seeking!
Step by Step Answer:
a b The monthly time series shows two patterns positive trend and seasonality The seasonality i...View the full answer

Answered By
PALASH JHANWAR
I am a Chartered Accountant with AIR 45 in CA - IPCC. I am a Merit Holder ( B.Com ). The following is my educational details.
PLEASE ACCESS MY RESUME FROM THE FOLLOWING LINK: https://drive.google.com/file/d/1hYR1uch-ff6MRC_cDB07K6VqY9kQ3SFL/view?usp=sharing
3+ Reviews
10+ Question Solved
Related Book For 

Statistical Techniques In Business And Economics
ISBN: 9781260239478
18th Edition
Authors: Douglas Lind, William Marchal, Samuel Wathen
Question Posted:
