

The table shows the labor force and the unemployment rate for three counties in northwest Pennsylvania for
Question:
The table shows the labor force and the unemployment rate for three counties in northwest Pennsylvania for 2010 and 2019.
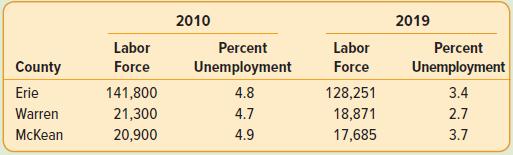
a. In 2010, the national unemployment rate was 9.3%. For 2010, compute a simple average unemployment index for the region using the national unemployment rate as the base. Interpret the simple average index.
b. In 2019, the national unemployment rate was 3.6%. For 2019, compute a simple average unemployment index for the region using the national unemployment rate as the base. Interpret the simple average index.
c. Use the data for this region of northwest Pennsylvania to create a weighted unemployment index using the Laspeyres method. Use 2010 as the base period. Interpret the index.
Step by Step Answer:
a To compute the simple average unemployment index for the region in 2010 we can take the average of ...View the full answer


Statistical Techniques In Business And Economics
ISBN: 9781260239478
18th Edition
Authors: Douglas Lind, William Marchal, Samuel Wathen
