

Question: 11.60 Race and party ID The table shows data from an SPSS printout for some analyses of 2008 GSS data on race and party ID.
11.60 Race and party ID The table shows data from an SPSS printout for some analyses of 2008 GSS data on race and party ID.
a. Interpret the expected count for the first cell.
b. Interpret the standardized residual of 12.5 for the first cell (SPSS calls it an adjusted residual).
c. How would you summarize to someone who has never studied statistics what you learn from the standardized residuals given in the four corner cells on this printout?
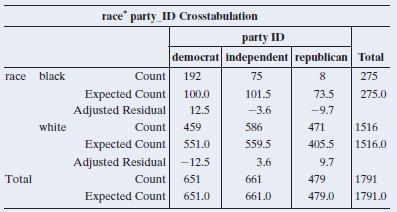
race party ID Crosstabulation party ID democrat independent republican Total race black Count 192 75 8 275 Expected Count 100.0 101.5 73.5 275.0 Adjusted Residual 12.5 -3.6 -9.7 white Count 459 586 471 1516 Expected Count 551.0 559.5 405.5 1516.0 Adjusted Residual -12.5 3.6 9.7 Total Count 651 661 479 1791 Expected Count 651.0 661.0 479.0 1791.0
Step by Step Solution
There are 3 Steps involved in it

Get step-by-step solutions from verified subject matter experts