

Question: 13. Sampling Plans The distribution of x using sampling plans with two different sample sizes are shown in the graphs that follow The mean of
13. Sampling Plans The distribution of x using sampling plans with two different sample sizes are shown in the graphs that follow
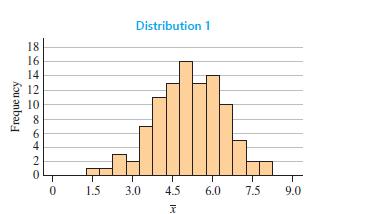
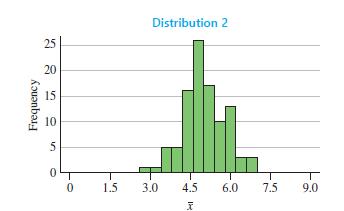
The mean of the population from which these samples came is equal to m 55.5. Which of these two sampling plans would you choose in estimating the population mean? Explain.
Frequency 18 Distribution 1 8642086420 16 14 12 10 0 1.5 3.0 4.5 6.0 7.5 9.0 I
Step by Step Solution
There are 3 Steps involved in it
1 Expert Approved Answer
Step: 1 Unlock

Question Has Been Solved by an Expert!
Get step-by-step solutions from verified subject matter experts
Step: 2 Unlock
Step: 3 Unlock