

Question: 13.33 Strength residuals In Chapter 12, we analyzed strength data for a sample of female high school athletes. The following figure is a residual plot
13.33 Strength residuals In Chapter 12, we analyzed strength data for a sample of female high school athletes. The following figure is a residual plot for the multiple regression model relating the maximum number of pounds the athlete could bench press (maxBP) to the number of 60-pound bench presses (BP60) and the number of 200-pound leg presses (LP200). It plots the standardized residuals against the values of LP200.
a. You don’t see BP60 on the plot, so how do its values affect the analysis?
b. Explain how the plot might suggest less variability at the lower values of LP200.
c. Suppose you remove the three points with standardized residuals around -2. Then is the evidence about variability in part b so clear? What does this suggest about cautions in looking at residual plots?
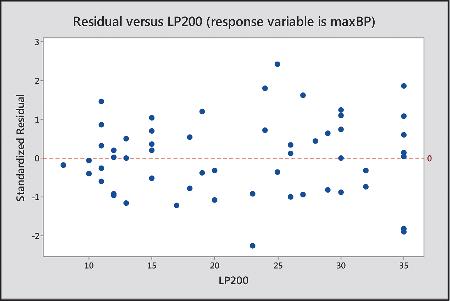
Standardized Residual -2 -1 2 3 10 Residual versus LP200 (response variable is maxBP) .. 15 20 25 30 35 LP200
Step by Step Solution
There are 3 Steps involved in it

Get step-by-step solutions from verified subject matter experts