

Question: 13.32 Body weight residuals Examples 47 used multiple regression to predict total body weight of college athletes in terms of height, percent body fat, and
13.32 Body weight residuals Examples 4–7 used multiple regression to predict total body weight of college athletes in terms of height, percent body fat, and age. The following figure shows a histogram of the standardized residuals resulting from fitting this model.
a. About which distribution do these give you information—
the overall distribution of weight or the conditional distribution of weight at fixed values of the predictors?
b. What does the histogram suggest about the likely shape of this distribution? Why?
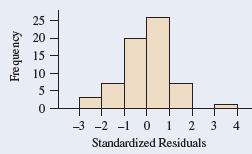
Frequency 15 10 22505o -3-2-1 0 1 2 3 4 Standardized Residuals
Step by Step Solution
There are 3 Steps involved in it
1 Expert Approved Answer
Step: 1 Unlock

Question Has Been Solved by an Expert!
Get step-by-step solutions from verified subject matter experts
Step: 2 Unlock
Step: 3 Unlock