

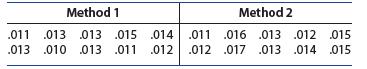
Question: 21. Ore Samples A geologist collected 20 different ore samples of equal weight and randomly divided them into two groups. She measured the titanium (Ti)
21. Ore Samples A geologist collected 20 different ore samples of equal weight and randomly divided them into two groups. She measured the titanium (Ti) content of the samples using two different methods.
a. Draw stem and leaf plots for the two data sets. Visually compare their centers and their ranges.
b. Calculate the sample means and standard deviations for the two sets. Do the calculated values confirm your conclusions from part a?
Method 1 .011 .013 .013 .013 .013 .015 .014 .013 .010 .013 .011 .012 Method 2 .011 .016 .013 .012 .015 .012 .017 .013 .014 .015
Step by Step Solution
There are 3 Steps involved in it
1 Expert Approved Answer
Step: 1 Unlock

Question Has Been Solved by an Expert!
Get step-by-step solutions from verified subject matter experts
Step: 2 Unlock
Step: 3 Unlock