

Question: 2.19 Split Stems The figure below shows the stem-and-leaf plot for the cereal sugar values from Example 5, using split stems. Stem and Leaf Plot
2.19 Split Stems The figure below shows the stem-and-leaf plot for the cereal sugar values from Example 5, using split stems.
Stem and Leaf Plot for Cereal Sugar Values with Leaf Unit = 1000
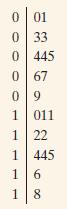
a. What was the smallest and largest amount of sugar found in the 20 cereals?
b. What sugar values are represented on the 6th line of the plot?
c. How many cereals have a sugar content less than 5 g?
0 01 0 33 0 445 0 67 09 1 011 1 22 1 445 1 16 1 8
Step by Step Solution
There are 3 Steps involved in it
1 Expert Approved Answer
Step: 1 Unlock

Question Has Been Solved by an Expert!
Get step-by-step solutions from verified subject matter experts
Step: 2 Unlock
Step: 3 Unlock