

Question: The figure below shows the stem-and-leaf plot for the cereal sugar values from Example 5, using split stems. Stem and Leaf Plot for Cereal Sugar
The figure below shows the stem-and-leaf plot for the cereal sugar values from Example 5, using split stems.
Stem and Leaf Plot for Cereal Sugar Values with Leaf Unit = 1000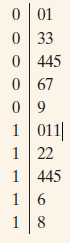 a. What was the smallest and largest amount of sugar found in the 20 cereals?
b. What sugar values are represented on the 6th line of the plot?
c. How many cereals have a sugar content less than 5 g?
0 01 0 33 0 445 0 67 1 011 1 22 1 445 16 18
Step by Step Solution
3.38 Rating (173 Votes )
There are 3 Steps involved in it
a Smallest 0 g largest 1... View full answer

Get step-by-step solutions from verified subject matter experts
Document Format (2 attachments)
1544_605d88e1f10e5_675163.pdf
180 KBs PDF File
1544_605d88e1f10e5_675163.docx
120 KBs Word File