

Question: 2.82 CO2 comparison The vertical side-by-side box plots shown below compare per capita carbon dioxide emissions in 2011 for many Central and South American and
2.82 CO2 comparison The vertical side-by-side box plots shown below compare per capita carbon dioxide emissions in 2011 for many Central and South American and European nations. (Data available on the book’s website. Source: www.eia.gov)
a. Give the approximate value of carbon dioxide emissions for the outliers shown. (There are actually two outliers.)
b. What shape would you predict for the distribution in Central and South America? Why?
c. Summarize how the carbon dioxide emissions compare between the two regions.
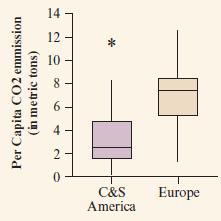
Per Capita CO2 emmission (in metric tons) 14 120* 8 6 2 0 C&S Europe America
Step by Step Solution
There are 3 Steps involved in it

Get step-by-step solutions from verified subject matter experts