

Question: 3. Refer to Exercise 1. What do the normal probability plot and the residuals versus fit plot tell you about the validity of your analysis
3. Refer to Exercise 1. What do the normal probability plot and the residuals versus fit plot tell you about the validity of your analysis of variance results?
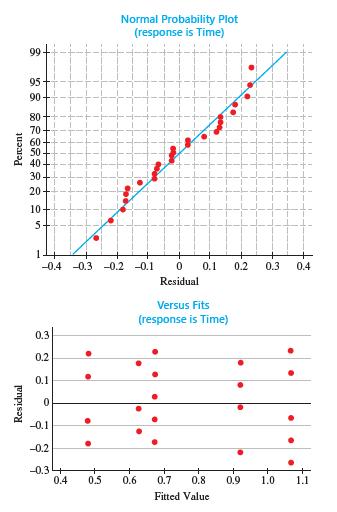
Residual Percent 95- 90- 80 70 60 50 40 30 20 10+ 5+ Normal Probability Plot (response is Time) 1 -0.4 -0.3 -0.2 -0.1 0 0.1 0.2 0.3 0.4 Residual 0.3 0.2 0.1 0 Versus Fits (response is Time) -0.1 -0.2 -0.3 0.4 0.5 0.6 0.7 0.8 0.9 1.0 1.1 Fitted Value
Step by Step Solution
There are 3 Steps involved in it
1 Expert Approved Answer
Step: 1 Unlock

Question Has Been Solved by an Expert!
Get step-by-step solutions from verified subject matter experts
Step: 2 Unlock
Step: 3 Unlock