

Question: 6.17 Probability in graph For the normal distributions shown below, use Table A, software, or a calculator to find the probability that an observation falls
6.17 Probability in graph For the normal distributions shown below, use Table A, software, or a calculator to find the probability that an observation falls in the shaded region.
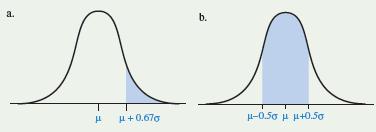
a. P b. +0.670 -0.50 +0.5
Step by Step Solution
There are 3 Steps involved in it
1 Expert Approved Answer
Step: 1 Unlock

Question Has Been Solved by an Expert!
Get step-by-step solutions from verified subject matter experts
Step: 2 Unlock
Step: 3 Unlock