

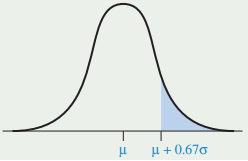
Question: For the normal distributions shown below, use Table A, software, or a calculator to find the probability that an observation falls in the shaded region.
a.
b.
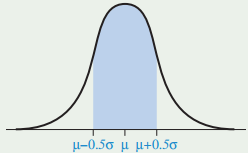
H + 0.670 -0.5 +0.5
Step by Step Solution
★★★★★
3.14 Rating (159 Votes )
There are 3 Steps involved in it
1 Expert Approved Answer
Step: 1 Unlock

a The observation would fall 067 standard deviations above the mean and thus would have a zsc... View full answer
Question Has Been Solved by an Expert!
Get step-by-step solutions from verified subject matter experts
Step: 2 Unlock
Step: 3 Unlock
Document Format (2 attachments)
1544_605d88e207986_676233.pdf
180 KBs PDF File
1544_605d88e207986_676233.docx
120 KBs Word File