

Question: 9.24 Which cola? The 49 students in a class at the University of Florida made blinded evaluations of pairs of cola drinks. For the 49
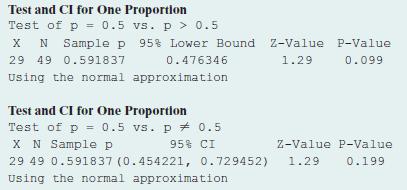
9.24 Which cola? The 49 students in a class at the University of Florida made blinded evaluations of pairs of cola drinks. For the 49 comparisons of Coke and Pepsi, Coke was preferred 29 times. In the population that this sample represents, is this strong evidence that a majority prefers one of the drinks? Refer to the following MINITAB printout.
a. Explain how to get the test statistic value that MINITAB reports.
b. Explain how to get the P-value. Interpret it.
c. Based on the result in part
b, does it make sense to accept H0? Explain.
d. What does the 95% confidence interval tell you that the test does not?
Test and CI for One Proportion Test of p = 0.5 vs. p > 0.5 X N Sample p 95% Lower Bound Z-Value P-Value 29 49 0.591837 0.476346 Using the normal approximation 1.29 0.099 Test and CI for One Proportion Test of p = 0.5 vs. p 0.5 X N Sample p 95% CI Z-Value P-Value 29 49 0.591837 (0.454221, 0.729452) 1.29 Using the normal approximation 0.199
Step by Step Solution
There are 3 Steps involved in it

Get step-by-step solutions from verified subject matter experts