

A student wants to examine the distribution of their scores as shown on their academic transcript. To
Question:
A student wants to examine the distribution of their scores as shown on their academic transcript.
To this end, they constructed the stem-and-leaf plot of their records:
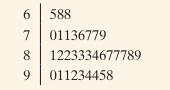
a. Identify the number of courses validated by the student, their minimum and maximum scores.
b. Sketch a dot plot for this data.
c. Sketch a histogram for this data with intervals of length 10.
Step by Step Answer:

This question has not been answered yet.
You can Ask your question!
Related Book For 
Statistics The Art And Science Of Learning From Data
ISBN: 9781292444765
5th Global Edition
Authors: Alan Agresti, Christine A. Franklin, Bernhard Klingenberg
Question Posted:
