

The first graph shows a histogram of the Central Park, New York, annual average temperatures from 1869
Question:
The first graph shows a histogram of the Central Park, New York, annual average temperatures from 1869 to 2018.
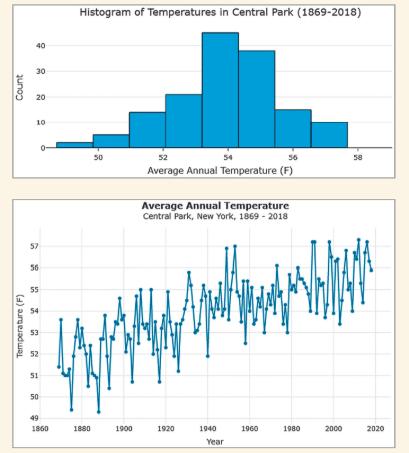
a. Describe the shape of the distribution.
b. What information can the time plot show that a histogram cannot provide?
c. What information does the histogram show that a time plot does not provide?
Step by Step Answer:

This question has not been answered yet.
You can Ask your question!
Related Book For 
Statistics The Art And Science Of Learning From Data
ISBN: 9781292444765
5th Global Edition
Authors: Alan Agresti, Christine A. Franklin, Bernhard Klingenberg
Question Posted:
