

Question: Create a scatterplot of the following data on the average annual household income and the average cost of a three-bedroom, 1-bath home (both to the
Create a scatterplot of the following data on the average annual household income and the average cost of a three-bedroom, 1½-bath home (both to the nearest thousand dollars) in 10 geographic areas: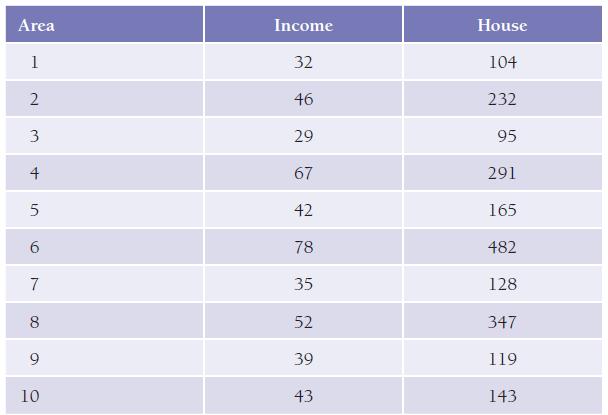
Area 1 2 3 4 5 6 7 8 9 10 Income 32 46 29 67 42 78 35 52 39 43 House 104 232 95 291 165 482 128 347 119 143
Step by Step Solution
★★★★★
3.42 Rating (161 Votes )
There are 3 Steps involved in it
1 Expert Approved Answer
Step: 1 Unlock

The small sample ... View full answer
Question Has Been Solved by an Expert!
Get step-by-step solutions from verified subject matter experts
Step: 2 Unlock
Step: 3 Unlock