

Question: Create a scatterplot of the following number of hours 12 students spend playing computer games per day and their academic average (in percentage). Student #
Create a scatterplot of the following number of hours 12 students spend playing computer games per day and their academic average (in percentage).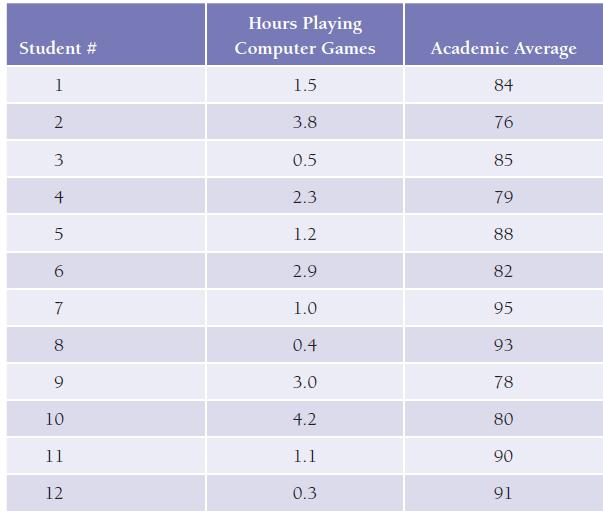
Student # 1 2 3 4 5 7 8 10 11 12 Hours Playing Computer Games 1.5 3.8 0.5 2.3 1.2 2.9 1.0 0.4 3.0 4.2 1.1 0.3 Academic Average 84 76 85 79 88 82 95 93 78 80 90 91
Step by Step Solution
★★★★★
3.37 Rating (156 Votes )
There are 3 Steps involved in it
1 Expert Approved Answer
Step: 1 Unlock

The unreliability of th... View full answer
Question Has Been Solved by an Expert!
Get step-by-step solutions from verified subject matter experts
Step: 2 Unlock
Step: 3 Unlock