

The screenshot below, taken from the Multivariate Relationships app, shows a scatterplot of the average teacher salary
Question:
The screenshot below, taken from the Multivariate Relationships app, shows a scatterplot of the average teacher salary (in USD) and the average SAT score (both from 2016) in the 50 U.S. states, with a regression line superimposed.
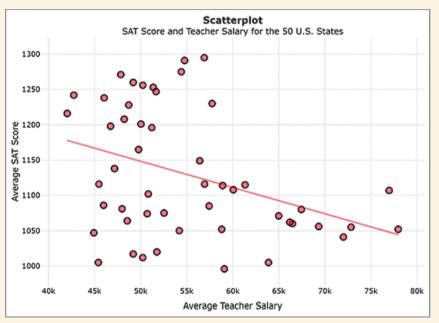
a. The correlation coefficient between the average teacher salary and the average SAT score is given by r = -0.23, and the regression line has a slope of b = -0.0037. For the states with higher average teacher salaries, should these results be used to argue for a decrease in the teacher’s salary, as this may lead to better SAT performance?
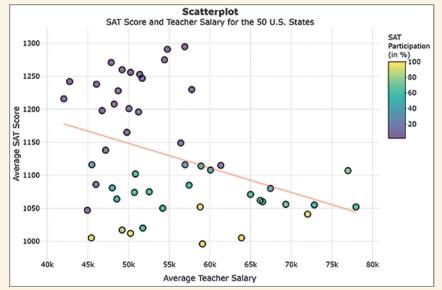
b. An important variable recorded with this data is the SAT participation rate, measured as the percentage of students who take the SAT in a state. This may vary from as low as 10% to as high as 100%. The following screenshot (reproducible via the Multivariate Relationships app) colors the dots of the scatterplot according to the percent of students participating in the SAT. What additional information does this provide over the first scatterplot?
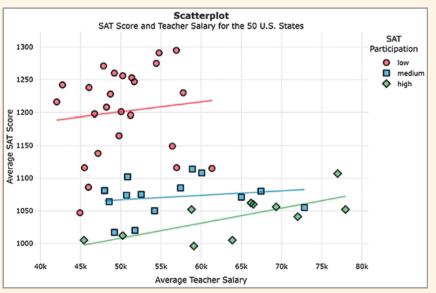
c. When grouping states into three groups (“low,”
“medium,” and “high”) according to their SAT participation rate, we obtain the following scatterplot with superimposed regression lines for each group (reproducible via the Multivariate Relationships app).
The correlation coefficient r between teacher salary and SAT score now equals 0.11 for states with low participation, 0.18 for states with medium participation, and 0.71 for states with high SAT participation rates.
How did adjusting for the confounding variable SAT Participation affect the association? (Background information: For states with low participation rates, typically only the top students tend to take the SAT as a means to get into good colleges, leading to relatively high average SAT scores for those states. For states with high participation rates, almost all students take the SAT, resulting in relatively lower average SAT scores.)
Step by Step Answer:


Statistics The Art And Science Of Learning From Data
ISBN: 9781292444765
5th Global Edition
Authors: Alan Agresti, Christine A. Franklin, Bernhard Klingenberg
